November 12, 2025 a 07:31 am


PRU: Dividend Analysis - Prudential Financial, Inc.
Prudential Financial, Inc. (PRU) is a well-established player in the financial sector with a robust dividend policy supported by a significant market capitalization. The company has demonstrated a consistent commitment to returning capital to shareholders, as evidenced by its long-standing dividend history. Despite minor volatility, the company continues to exhibit potential for steady dividend payouts, making it a noteworthy contender for income-focused investors.
📊 Overview
Prudential Financial operates within a stable sector, showcasing a compelling dividend yield of 5.06%, signifying an appealing income stream for investors. The current dividend per share is $5.29, with a strong history of 24 uninterrupted years, despite a recession-induced cut in 2008.
| Metric | Details |
|---|---|
| Sector | Financial |
| Dividend Yield | 5.06% |
| Current Dividend per Share | 5.29 USD |
| Dividend History | 24 years |
| Last Cut or Suspension | 2008 |
🗣️ Dividend History
The extensive dividend history of Prudential demonstrates its long-term reliability and commitment to shareholder returns. Historical continuity in dividend payments reflects the company's financial stability and robust cash flow management, important in maintaining investor confidence.
| Year | Dividend per Share (USD) |
|---|---|
| 2025 | 5.40 |
| 2024 | 5.20 |
| 2023 | 5.00 |
| 2022 | 4.80 |
| 2021 | 4.60 |
📈 Dividend Growth
Prudential’s dividend growth over the past 3 to 5 years indicates a moderate upward trend, showcasing the company’s commitment to enhancing shareholder value. This historical growth is a critical indicator of future potential earnings and a sound strategy for inflation-beating income.
| Time | Growth |
|---|---|
| 3 years | 4.17% |
| 5 years | 5.39% |
The average dividend growth is 5.39% over 5 years. This shows moderate but steady dividend growth.
✅ Payout Ratio
The payout ratio is a crucial metric in assessing dividend sustainability. Prudential maintains a balanced approach, with an EPS-based payout ratio of 71% and a more conservative FCF-based ratio of 35.44%. This balance ensures maintained financial health and ability to cover dividend obligations even during low earnings periods.
| Key Figure | Ratio |
|---|---|
| EPS-based Payout Ratio | 71.05% |
| Free Cash Flow-based Payout Ratio | 35.44% |
📊 Cashflow & Capital Efficiency
Analyzing cash flow and capital efficiency is essential for understanding the company's operational productivity and financial health. Key indicators such as free cash flow yield and CAPEX vs. operating cash flow offer insights into operational efficiency and effective capital allocation.
| Year | 2024 | 2023 | 2022 |
|---|---|---|---|
| Free Cash Flow Yield | 20.06% | 17.27% | 13.93% |
| Earnings Yield | 6.44% | 6.60% | -4.45% |
| CAPEX to Operating Cash Flow | 0% | 0% | 0% |
| Stock-based Compensation to Revenue | 0% | 0% | 0.39% |
| Free Cash Flow / Operating Cash Flow Ratio | 1 | 1 | 1 |
The stable free cash flow yield and low CAPEX signify Prudential's efficient use of capital, enhancing financial predictability and resilience.
⚖️ Balance Sheet & Leverage Analysis
The analysis of Prudential's balance sheet highlights financial stability, characterized by a manageable debt profile and strong liquidity ratios. These metrics are crucial for ongoing operational flexibility and risk mitigation.
| Year | 2024 | 2023 | 2022 |
|---|---|---|---|
| Debt-to-Equity | 0.77 | 0.75 | 1.30 |
| Debt-to-Assets | 0.03 | 0.03 | 0.03 |
| Debt-to-Capital | 0.44 | 0.43 | 0.56 |
| Net Debt to EBITDA | 0.86 | 0.48 | -2.14 |
| Current Ratio | 5.74 | 1.94 | 0.44 |
| Quick Ratio | 5.74 | 1.94 | 22.81 |
| Financial Leverage | 26.39 | 25.92 | 42.46 |
The favorable trends in leverage ratios and liquidity indicators suggest a solid financial foundation, boosting investor confidence in long-term solvency.
💹 Fundamental Strength & Profitability
Key profitability ratios indicate Prudential's operational success and efficiency. Return on equity and asset-based metrics are indicators of effective resource utilization, deeply impacting overall financial health.
| Year | 2024 | 2023 | 2022 |
|---|---|---|---|
| Return on Equity | 9.78% | 8.94% | -10.14% |
| Return on Assets | 0.37% | 0.35% | -0.24% |
| Net Profit Margin | 3.86% | 4.58% | -2.89% |
| EBIT Margin | 4.54% | 5.66% | -3.32% |
| EBITDA Margin | 5.08% | 5.53% | -3.12% |
| Gross Margin | 24.76% | 32.35% | 20.83% |
| Research & Development to Revenue | 0% | 0% | 0% |
Prudential’s profitability indicators reflect strategic strength but highlight areas for revenue enhancement and efficiency optimization.
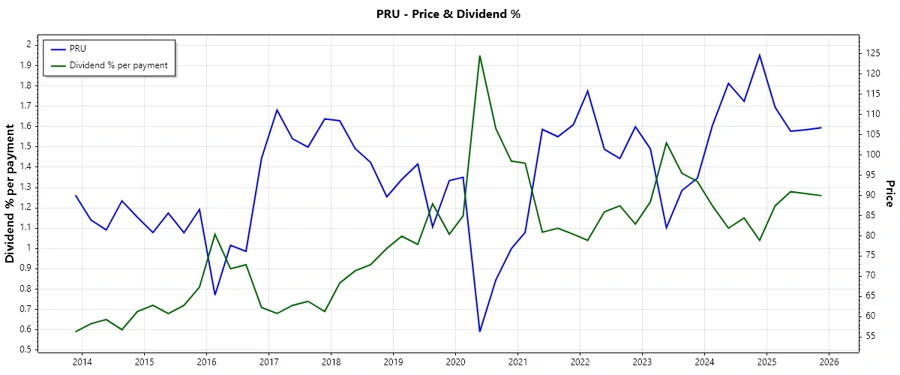
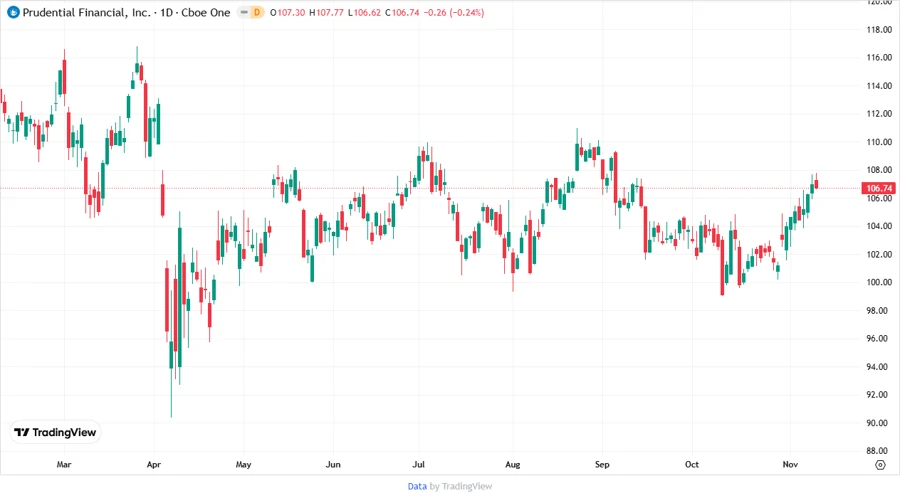
📈 Price Development
🔍 Dividend Scoring System
| Criterion | Score | Evaluation |
|---|---|---|
| Dividend Yield | 4 | |
| Dividend Stability | 5 | |
| Dividend Growth | 3 | |
| Payout Ratio | 4 | |
| Financial Stability | 4 | |
| Dividend Continuity | 5 | |
| Cashflow Coverage | 5 | |
| Balance Sheet Quality | 4 |
Overall Score: 34/40
🔍 Rating
Prudential Financial, Inc. is rated as a strong contender for dividend-focused investors, emphasizing robust payout reliability, growing income streams, and solid financial metrics. With a comprehensive scoring of 34 out of 40, PRU is recommended as a "Buy" for those seeking stable and growing dividends within the financial sector.
Smart Data Insight
Master the Perfect Entry & Exit for this Stock
Don't leave your profits to chance. Historically, this stock follows specific seasonal patterns that institutional traders use to maximize returns.
- ✅ Identify the "Golden Buying Window"
- ✅ Avoid high-risk correction cycles
- ✅ Backtested data from the last 20+ years