May 13, 2026 a 08:15 am
PPL: Trend and Support & Resistance Analysis - PPL Corporation
PPL Corporation has shown a fluctuating stock performance in recent months amidst a volatile utility sector. The company, which operationally spans across the United States and the United Kingdom, faces challenges in energy distribution and generation, particularly from coal, gas, hydro, and solar resources. With its sizable customer base in electricity and natural gas, PPL is strategically positioned in key geographic areas but is subject to regulatory and environmental pressures.
Trend Analysis
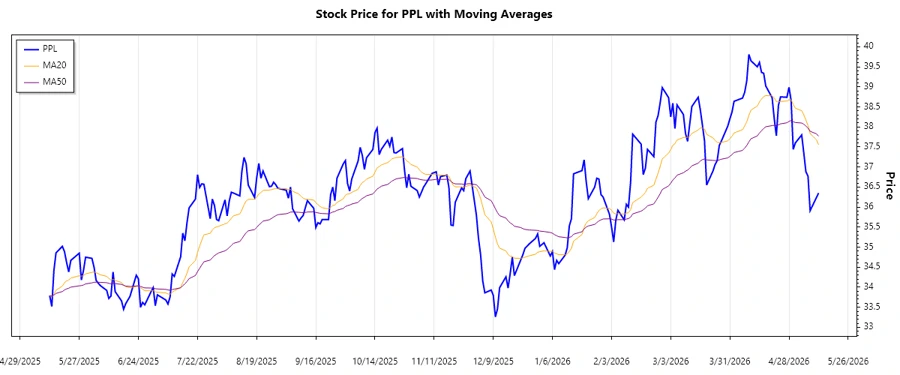
The trend assessment for the PPL stock based on the provided data indicates a dynamic movement over the months. Using a 20-day and a 50-day EMA for trend detection, calculations show:
| Date | Close Price | Trend |
|---|---|---|
| 2026-05-12 | 36.35 | ▼ |
| 2026-05-11 | 36.24 | ▼ |
| 2026-05-08 | 35.91 | ▼ |
| 2026-05-07 | 36.77 | ▲ |
| 2026-05-06 | 36.88 | ▲ |
| 2026-05-05 | 37.35 | ▲ |
| 2026-05-04 | 37.80 | ▲ |
The recent trend analysis reveals a slight upward trajectory which is inconsistent in the short term but indicative of bullish potential.
Support and Resistance
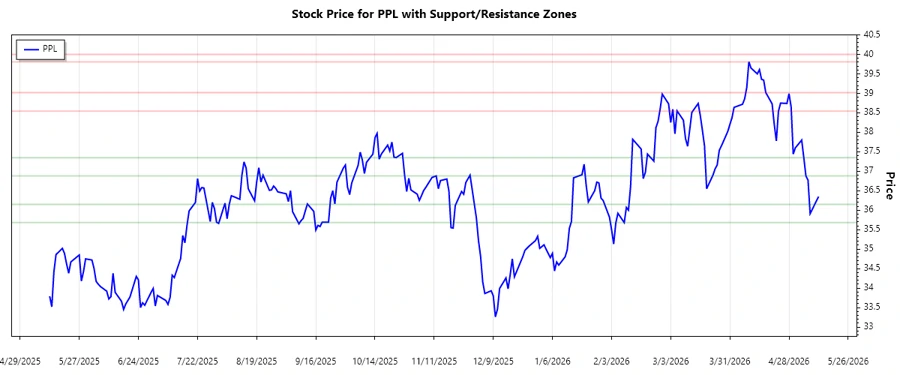
Based on the historical data, key support and resistance levels have been identified:
| Type | Zone Range | Direction |
|---|---|---|
| Support | 35.68 - 36.15 | ⊥ |
| Support | 36.88 - 37.35 | ⊥ |
| Resistance | 38.54 - 39.02 | ⊤ |
| Resistance | 39.81 - 40.00 | ⊤ |
The current price is oscillating near critical support zones, indicating a strong need for maintaining above these levels for bullish confirmation.
Conclusion
PPL's stock performance showcases potential for a moderate uptrend, pending stability above key support levels. As the utility giant navigates regulatory challenges and fluctuating energy demands, its resilience will hinge on operational efficiencies and market conditions. Investors should monitor price action near established supports and resistances for potential breakouts, while being cautious of sector-specific risks.
Smart Data Insight
Master the Perfect Entry & Exit for this Stock
Don't leave your profits to chance. Historically, this stock follows specific seasonal patterns that institutional traders use to maximize returns.
- ✅ Identify the "Golden Buying Window"
- ✅ Avoid high-risk correction cycles
- ✅ Backtested data from the last 20+ years