May 01, 2026 a 05:15 am
PPL: Fibonacci Analysis - PPL Corporation
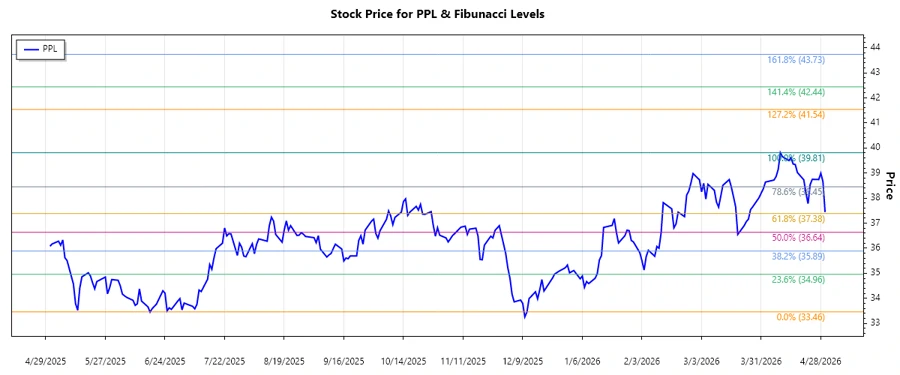
The PPL Corporation stock has exhibited noticeable price movements over recent months. As a utility holding company, PPL remains sensitive to changes in energy demand and regulations in the US and UK markets. The stock's technical analysis reveals an interesting trend that investors should watch closely as it could indicate key support and resistance levels.
Fibonacci Analysis
| Attribute | Details |
|---|---|
| Trend Type | Uptrend |
| Start Date | 2025-12-15 |
| End Date | 2026-04-09 |
| High Point | $39.81 on 2026-04-09 |
| Low Point | $33.46 on 2025-12-15 |
| Fibonacci Levels |
|
| Current Price Position | The current price of $37.44 is in the 0.236 Fibonacci retracement zone. |
| Technical Interpretation | The stock is currently testing a potential support level near the 0.236 retracement. This may provide a buying opportunity if the level holds, or signal further weakness if it gives way. |
Conclusion
The PPL Corporation has shown strength in its recent uptrend, driven by positive regulatory and market conditions. With the stock trading within the 0.236 Fibonacci retracement level, traders might find a potential support area, suggesting a possible continuation of the uptrend. However, a breach below this level could imply further downward pressure. Investors should weigh the supportive market dynamics against potential volatility in the utility sector, ensuring a balanced risk-reward assessment. Overall, PPL remains an intriguing prospect for those seeking exposure in utility stocks.