October 27, 2025 a 05:15 am
PPL: Fibonacci Analysis - PPL Corporation
PPL Corporation has shown consistent performance in the utility sector, serving a significant customer base across the U.S. and the U.K. The company's strategic focus on regulated markets provides stability, while investments in renewable energy may offer future growth opportunities. Technical analysis reveals key insights into the stock's recent price movements, essential for informed investment decisions.
Fibonacci Analysis
| Attribute | Details |
|---|---|
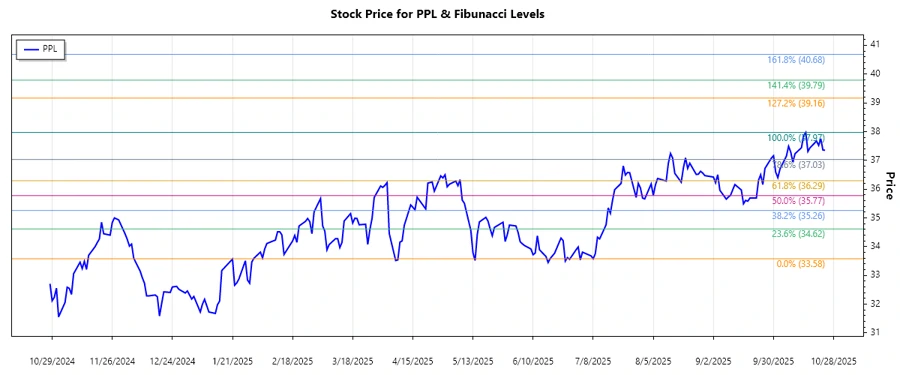
| Trend Duration | 2025-07-08 to 2025-10-24 |
| High Point | $37.97 on 2025-10-15 |
| Low Point | $33.58 on 2025-07-08 |
| Fibonacci Level | Price Level |
|---|---|
| 0.236 | $34.64 |
| 0.382 | $35.37 |
| 0.5 | $35.78 |
| 0.618 | $36.19 |
| 0.786 | $36.83 |
The current price, $37.35, is above all Fibonacci retracement levels, indicating that it is outside of the retracement zones.
Technically, this suggests that the stock may have established a new support level at the previous high, potentially resisting downward movements.
Conclusion
The PPL Corporation stock has demonstrated a robust upward trend, breaking past key Fibonacci retracement levels. As the stock remains above retracement zones, it signals potential ongoing strength, though investors should monitor for possible resistance at previous highs. Given current market conditions and PPL's strong foundation in regulated energy markets, the stock presents both opportunities for growth and potential risks if volatility increases. Technical indicators should be used alongside fundamental analysis to make well-rounded investment decisions.
Smart Data Insight
Master the Perfect Entry & Exit for this Stock
Don't leave your profits to chance. Historically, this stock follows specific seasonal patterns that institutional traders use to maximize returns.
- ✅ Identify the "Golden Buying Window"
- ✅ Avoid high-risk correction cycles
- ✅ Backtested data from the last 20+ years