October 12, 2025 a 03:15 pm
PPL: Fibonacci Analysis - PPL Corporation
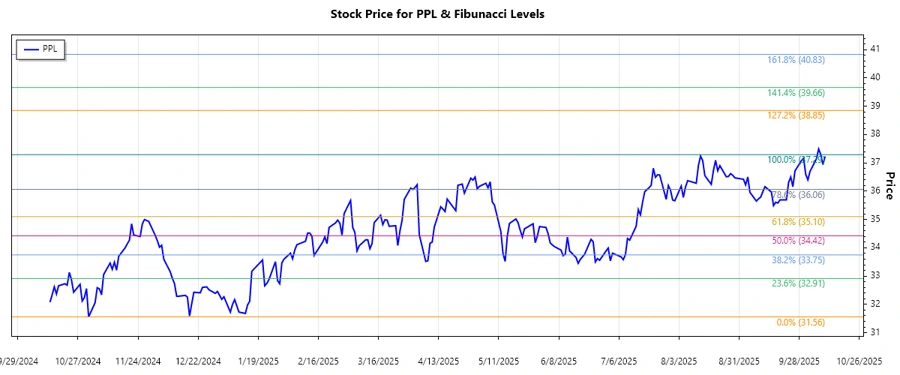
The PPL Corporation has demonstrated a gradual uptrend over the recent months, reflecting steady growth and resilience. The stock has shown notable movements influenced predominantly by market conditions and broader economic factors. As an established utility company, its stability in delivering electricity and natural gas gives it a firm footing in volatile markets, making it a noteworthy consideration for risk-averse investors.
Fibonacci Analysis
| Parameter | Value |
|---|---|
| Trend Start Date | 2024-12-31 |
| Trend End Date | 2025-10-10 |
| High (Date/Price) | 2025-07-28 / 37.29 |
| Low (Date/Price) | 2024-10-14 / 31.56 |
| Fibonacci 0.236 Level | $33.60 |
| Fibonacci 0.382 Level | $34.66 |
| Fibonacci 0.5 Level | $35.43 |
| Fibonacci 0.618 Level | $36.19 |
| Fibonacci 0.786 Level | $37.12 |
| Current Price Position | Retracement zone: 0.618 |
| Interpretation | The stock currently sits in the 0.618 Fibonacci retracement zone, potentially indicating support. |
The stock’s position within the 0.618 Fibonacci retracement zone suggests a potential support level, which could attract buyers, aiming to push the price higher.
Conclusion
PPL Corporation's stock has shown robust upward momentum in the analyzed period, with critical technical levels suggesting ongoing strength. Investors should cautiously monitor the Fibonacci levels as these represent potential support and resistance points. The stock's current position in the retracement zone hints at consolidation, but also the opportunity for further upward movement if broader market conditions remain favorable. Nevertheless, possible macroeconomic shifts and changes in regulatory policies could still impact future price movements.
Smart Data Insight
Master the Perfect Entry & Exit for this Stock
Don't leave your profits to chance. Historically, this stock follows specific seasonal patterns that institutional traders use to maximize returns.
- ✅ Identify the "Golden Buying Window"
- ✅ Avoid high-risk correction cycles
- ✅ Backtested data from the last 20+ years