September 29, 2025 a 11:44 am
PPL: Fibonacci Analysis - PPL Corporation
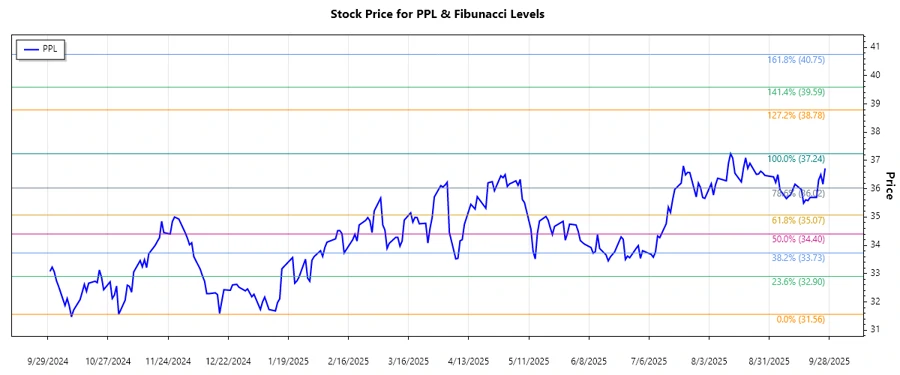
The PPL Corporation's stock has demonstrated a notable bullish trend over recent months. With a strong presence in the energy sector both in the US and UK, PPL has effectively leveraged its diversified utility services to maintain positive investor sentiment. As we explore the latest technical analysis, particularly the Fibonacci retracement levels, investors might find strategic points for potential entry or exit.
Fibonacci Analysis
| Start Date | End Date | High Price | High Date | Low Price | Low Date |
|---|---|---|---|---|---|
| 2025-01-03 | 2025-09-26 | 37.24 | 2025-08-13 | 31.56 | 2024-11-01 |
| Fibonacci Level | Price Level |
|---|---|
| 0.236 | 33.71 |
| 0.382 | 34.76 |
| 0.5 | 35.69 |
| 0.618 | 36.62 |
| 0.786 | 37.52 |
The current stock price of $36.72 is closely situated within the 0.618 retracement level, indicating a potential area of strong resistance. The Fibonacci analysis suggests that if this level holds, we could see a reversal or consolidation.
Conclusion
PPL Corporation exhibits a strong bullish trend, evidenced by its consistent stock price increase over the analyzed period. While the stock is near a critical Fibonacci resistance level, a breakthrough could signal continued upward momentum. However, should the price retract from this point, investors might expect consolidation or a minor pullback. Analysts should maintain a balanced view, considering potential macroeconomic factors and company fundamentals that may influence sustainability of this trend. Overall, PPL presents a promising opportunity for growth-oriented investors with a calculated approach to risk management.
Smart Data Insight
Master the Perfect Entry & Exit for this Stock
Don't leave your profits to chance. Historically, this stock follows specific seasonal patterns that institutional traders use to maximize returns.
- ✅ Identify the "Golden Buying Window"
- ✅ Avoid high-risk correction cycles
- ✅ Backtested data from the last 20+ years