April 13, 2026 a 07:46 am

PPL: Dividend Analysis - PPL Corporation
PPL Corporation demonstrates a robust dividend profile with over four decades of consistent payments, making it a reliable choice for dividend investors. Despite the negative recent dividend growth over five years, its longstanding history and moderate payout ratio provide a sense of stability. However, due to recent challenges reflected in its negative cash flow yields and declining growth rates, investors might weigh these factors when considering future prospects.
📊 Overview
PPL Corporation operates within the utilities sector, which is often favored for stable dividend payments. Currently, it offers a dividend yield of 2.91%, with a current dividend per share of $1.072. The company boasts an impressive 43-year dividend history but has recently experienced some setbacks, with the last dividend cut or suspension not reported, suggesting reliability in its dividend policy.
| Detail | Value |
|---|---|
| Sector | Utilities |
| Dividend yield | 2.91% |
| Current dividend per share | $1.072 |
| Dividend history | 43 years |
| Last cut or suspension | None |
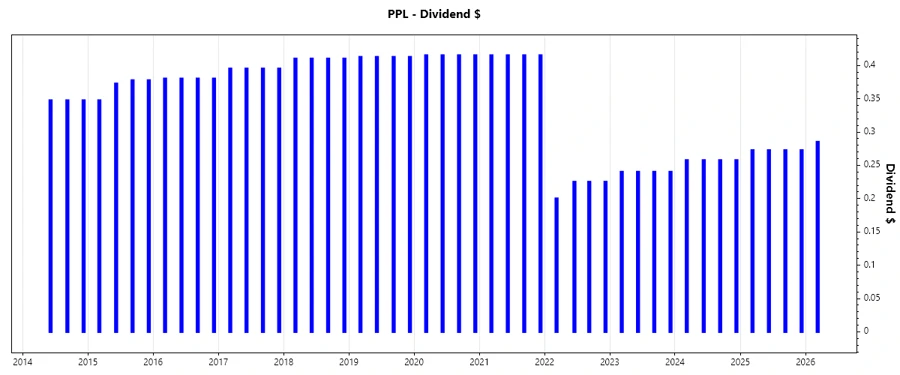
🗣️ Dividend History
The dividend history provides insights into PPL's commitment to returning value to shareholders over the years. Consistency in dividend distribution often signals financial health and stability, attractive to income-focused investors.
| Year | Dividend Per Share ($) |
|---|---|
| 2026 | 0.285 |
| 2025 | 1.090 |
| 2024 | 1.030 |
| 2023 | 0.960 |
| 2022 | 0.875 |
📈 Dividend Growth
Dividend growth is critical for assessing future income potential. PPL Corporation's recent dividend growth rates have faced challenges, reflecting an economic environment that might affect payout increases.
| Time | Growth |
|---|---|
| 3 years | 7.60% |
| 5 years | -8.07% |
The average dividend growth is -8.07% over 5 years. This shows a decline in PPL's ability to enhance dividends, reflecting possible financial downturns or strategic adjustments.
🛡️ Payout Ratio
Payout ratios indicate what portion of earnings and free cash flow are distributed as dividends. This is essential for understanding dividend sustainability.
| Key figure | Ratio |
|---|---|
| EPS-based | 67.23% |
| Free cash flow-based | -57.53% |
The EPS-based payout ratio of 67.23% suggests a prudent payout that maintains room for future growth. In contrast, the negative FCF payout suggests challenges in maintaining dividend levels without earnings support.
💵 Cashflow & Capital Efficiency
Cashflow analysis provides insight into a company's financial health, emphasizing liquidity and capital allocation efficiency.
| Metric | 2023 | 2024 | 2025 |
|---|---|---|---|
| Free Cash Flow Yield | -3.16% | -1.94% | -5.41% |
| Earnings Yield | 3.70% | 3.71% | 4.56% |
| CAPEX to Operating Cash Flow | 1.36 | 1.20 | 1.53 |
| Stock-based Compensation to Revenue | 0.40% | 0.54% | 0.00% |
| Free Cash Flow / Operating Cash Flow Ratio | -35.95% | -19.87% | -53.29% |
PPL's negative free cash flow yields signal potential financial pressure. Capital efficiency ratios suggest prudence, but cash flow sustainability remains challenging, requiring careful future cash management.
📉 Balance Sheet & Leverage Analysis
Understanding leverage ratios and liquidity metrics helps assess the company's ability to meet its financial obligations and maintain stability.
| Metric | 2023 | 2024 | 2025 |
|---|---|---|---|
| Debt-to-Equity | 1.12 | 1.19 | 1.30 |
| Debt-to-Assets | 0.40 | 0.41 | 0.43 |
| Debt-to-Capital | 0.53 | 0.54 | 0.57 |
| Net Debt to EBITDA | 5.22 | 5.14 | 4.96 |
| Current Ratio | 0.88 | 0.86 | 0.86 |
| Quick Ratio | 0.73 | 0.71 | 0.74 |
| Financial Leverage | 2.82 | 2.92 | 3.04 |
PPL's high leverage ratios suggest a significant reliance on debt, while the below-average liquidity ratios point to potential short-term cash flow challenges.
✅ Fundamental Strength & Profitability
Profitability metrics such as return on equity and margins inform about the company's efficiency and competitive standing.
| Metric | 2023 | 2024 | 2025 |
|---|---|---|---|
| Return on Equity | 5.31% | 6.31% | 7.94% |
| Return on Assets | 1.89% | 2.16% | 2.61% |
| Net Margin | 8.90% | 10.49% | 13.06% |
| EBIT Margin | 19.13% | 21.91% | 25.22% |
| EBITDA Margin | 35.19% | 37.95% | 40.74% |
| Gross Margin | 39.41% | 40.10% | 39.05% |
| R&D to Revenue | 0.00% | 0.00% | 0.00% |
PPL's moderate returns and consistent margins highlight effective cost management, though competitive pressures may limit growth potential.
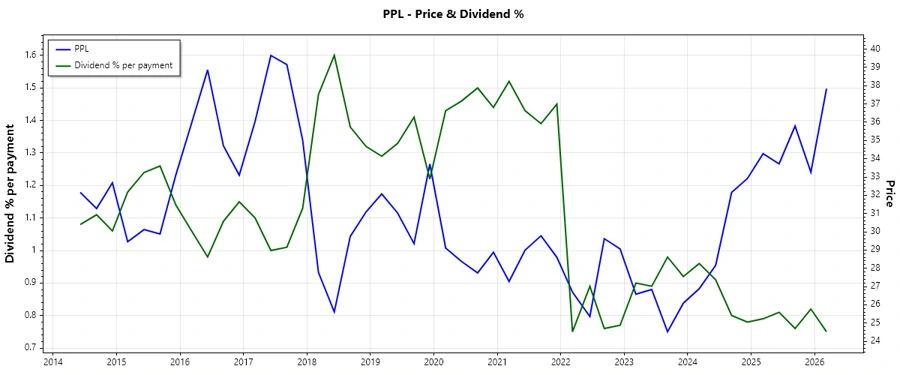
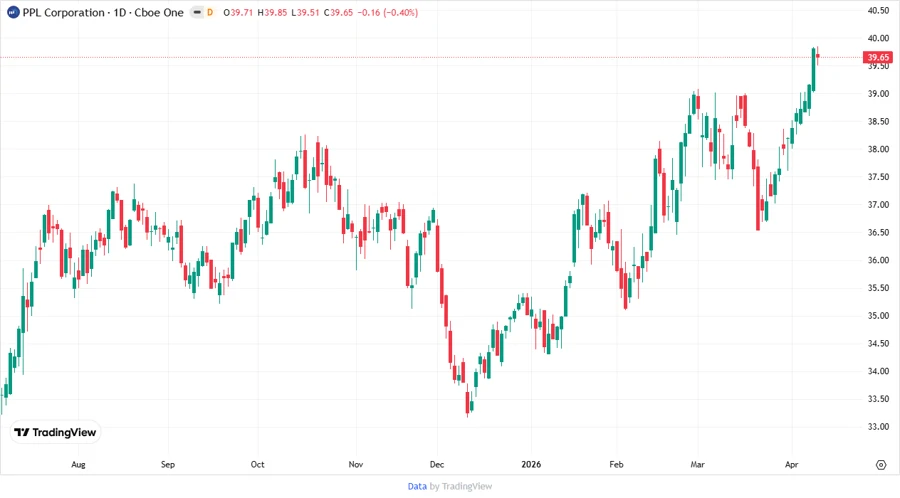
📈 Price Development
🟢 Dividend Scoring System
| Criteria | Score | Bar |
|---|---|---|
| Dividend yield | 3 | |
| Dividend Stability | 4 | |
| Dividend growth | 2 | |
| Payout ratio | 3 | |
| Financial stability | 3 | |
| Dividend continuity | 5 | |
| Cashflow Coverage | 2 | |
| Balance Sheet Quality | 3 |
Total Score: 25/40
🔍 Rating
PPL Corporation exhibits a strong historical commitment to dividends, but recent financial pressures could impact future distribution. With a total score of 25 out of 40 in our dividend scoring, it remains a cautious buy for dividend-focused investors, advisable for those prioritizing stability over high growth potential.