November 28, 2025 a 11:31 am
PPL: Dividend Analysis - PPL Corporation
PPL Corporation is a mature energy company with a significant track record of steady dividend distributions. Despite facing challenges in the past, particularly a dividend cut in 2022, the company's current dividend yield and market position demonstrate its continued commitment to returning value to shareholders. However, investors should be cautious about the negative dividend growth observed over recent periods, as it may indicate underlying financial strains.
📊 Overview
PPL operates within the Utilities sector, a space known for stable and consistent returns. Below is a snapshot of their current dividend metrics:
| Metric | Details |
|---|---|
| Sector | Utilities |
| Dividend Yield | 2.97 % |
| Current Dividend Per Share | 1.013 USD |
| Dividend History | 42 years |
| Last Cut/Suspension | 2022 |
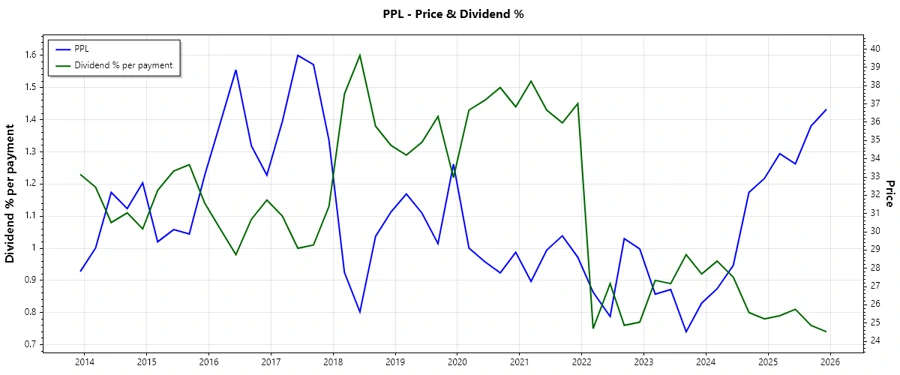
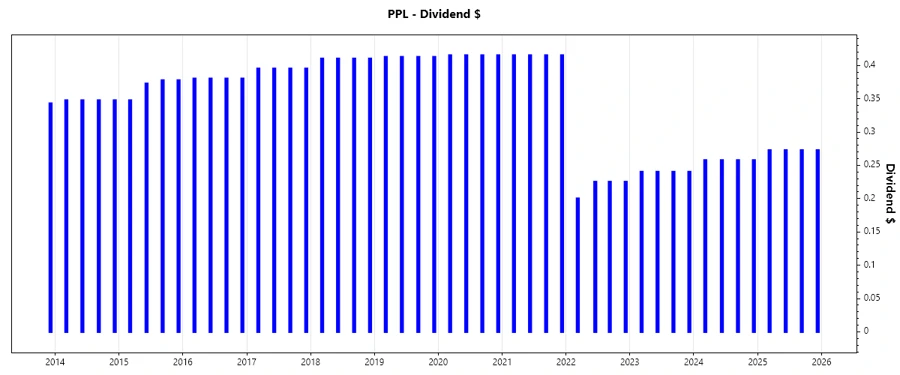
🗣️ Dividend History
The dividend history of PPL Corporation shows commendable longevity with 42 years of distribution. However, a notable reduction occurred in 2022 which stakeholders should consider.
| Year | Dividend Per Share (USD) |
|---|---|
| 2025 | 1.090 |
| 2024 | 1.030 |
| 2023 | 0.96 |
| 2022 | 0.875 |
| 2021 | 1.660 |
📈 Dividend Growth
While PPL has a storied past, recent dividend growth over the last few years shows a negative trend. Such figures warrant attention for long-term income investors.
| Time | Growth |
|---|---|
| 3 years | -0.15% |
| 5 years | -0.09% |
The average dividend growth is -0.09% over 5 years. This demonstrates modest cautionary downticks in payoff consistency.
⚠️ Payout Ratio
The payout ratio is crucial in assessing the sustainability of dividends. A high ratio can signal pressure on cash flows, especially if earnings or free cash flow is impacted.
| Key Figure | Ratio |
|---|---|
| EPS-based | 75.76 % |
| Free Cash Flow-based | -87.59 % |
The EPS payout ratio of 75.76% suggests a reasonable distribution relative to earnings. However, the negative FCF ratio signals potential sustainability concerns.
✅ Cashflow & Capital Efficiency
Understanding how effectively the company generates cash flow and utilizes capital directly influences its ability to sustain and grow dividend payouts.
| Measure | 2024 | 2023 | 2022 |
|---|---|---|---|
| Free Cash Flow Yield | -1.94% | -3.16% | -1.98% |
| Earnings Yield | 3.71% | 3.70% | 3.52% |
| CAPEX to Operating Cash Flow | 1.36 | 1.36 | 1.25 |
| Stock-based Compensation to Revenue | 0.00 | 0.00 | 0.00 |
| Free Cash Flow / Operating Cash Flow Ratio | -0.20 | -0.36 | -0.25 |
The negative Free Cash Flow Yield points to concerns over financial health, requiring scrutiny over fundamental income sources and capital allocation strategies.
📊 Balance Sheet & Leverage Analysis
A thorough balance sheet analysis helps deduce firm stability against liabilities, operational shortfalls, and leveraging capacity.
| Measure | 2024 | 2023 | 2022 |
|---|---|---|---|
| Debt-to-Equity | 1.19 | 1.12 | 1.02 |
| Debt-to-Assets | 0.41 | 0.40 | 0.38 |
| Debt-to-Capital | 0.54 | 0.53 | 0.51 |
| Net Debt to EBITDA | 5.14 | 5.22 | 5.21 |
| Current Ratio | 0.59 | 0.88 | 0.75 |
| Quick Ratio | 0.71 | 0.73 | 0.63 |
| Financial Leverage | 2.92 | 2.82 | 2.72 |
The High Debt-to-Equity and weak Quick Ratio highlight potentially strained liquidity and borrowing limits, marking areas of concern for long-term debt management.
🔍 Fundamental Strength & Profitability
Profitability metrics are pivotal indicators of how well a company utilizes its resources to generate revenue, impacting future growth potential.
| Measure | 2024 | 2023 | 2022 |
|---|---|---|---|
| Return on Equity | 6.31% | 5.31% | 5.43% |
| Return on Assets | 2.16% | 1.89% | 2.00% |
| Margins: Net | 10.49% | 8.90% | 9.57% |
| EBIT | 21.91% | 19.13% | 18.07% |
| EBITDA | 37.95% | 35.19% | 33.68% |
| Gross | 40.10% | 39.41% | 36.54% |
| Research & Development to Revenue | 0.00% | 0.00% | 0.00% |
Stable margins with gradual improvement, however, absence of R&D investment may stymie innovation and limit growth prospects amid industry disruption.
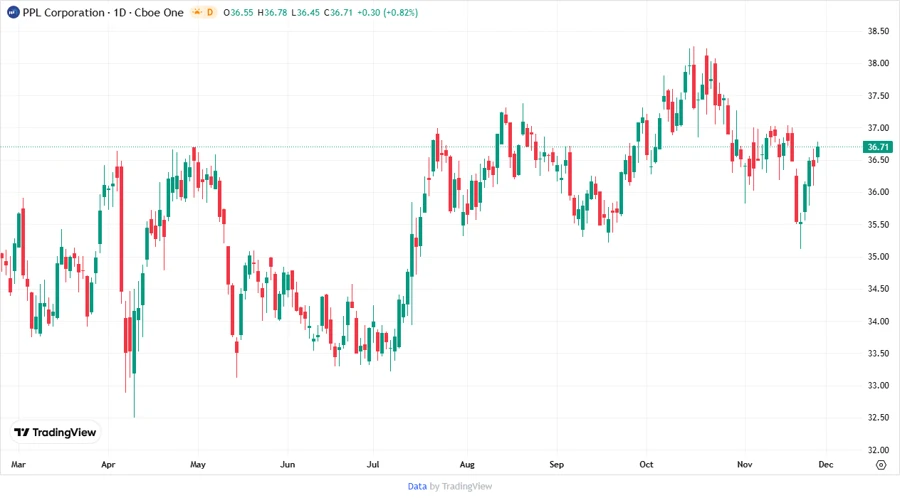
📉 Price Development
🏆 Dividend Scoring System
| Category | Score | Score Bar |
|---|---|---|
| Dividend yield | 3 | |
| Dividend Stability | 4 | |
| Dividend growth | 2 | |
| Payout ratio | 3 | |
| Financial stability | 2 | |
| Dividend continuity | 4 | |
| Cashflow Coverage | 2 | |
| Balance Sheet Quality | 3 |
Total Score: 23/40
🛈 Rating
Considering PPL Corporation's proven dividend track record and recent turbulent financial indicators, potential investors should weigh the company's solid yield against its financial vulnerabilities. The data reflects moderate capacity for sustaining dividends, though future economic shifts and internal financial recalibrations play a pivotal role. Investors seeking long-term, reliable dividend payers should consider a diversified strategy with cautious exposure to PPL's operational outlook and ongoing market adaptations.