September 23, 2025 a 03:32 pm
PPL: Dividend Analysis - PPL Corporation
PPL Corporation exhibits a consistent dividend history with over 40 years of payouts. However, recent challenges have affected dividend growth negatively. Investors should consider the stability of payouts alongside other financial metrics to assess potential returns.
Overview
| Factor | Value |
|---|---|
| Sector | Utilities |
| Dividend yield | 3.00% |
| Current dividend per share | $1.01 |
| Dividend history | 42 years |
| Last cut or suspension | None |
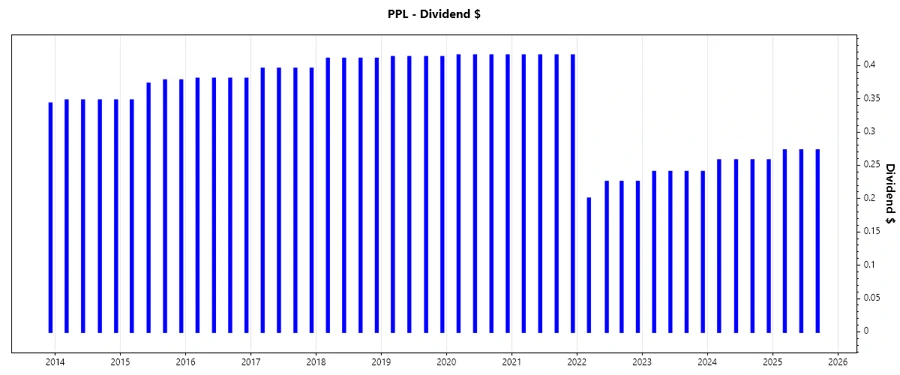
Dividend History
PPL Corporation has a long-standing dividend history, demonstrating reliability in investor payouts. Understanding historical payments helps assess the company's commitment to returns.
| Year | Dividend per Share |
|---|---|
| 2025 | $0.82 |
| 2024 | $1.03 |
| 2023 | $0.96 |
| 2022 | $0.88 |
| 2021 | $1.66 |
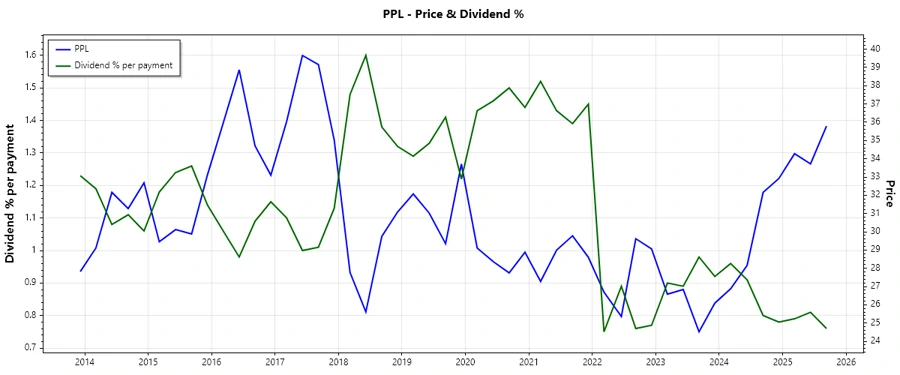
Dividend Growth
While PPL exhibits long-term reliability, recent years have seen a contraction in dividend growth. Monitoring these figures is crucial to forecast future sustainability and income potential.
| Time | Growth (%) |
|---|---|
| 3 years | -0.15% |
| 5 years | -0.09% |
The average dividend growth is -0.09% over 5 years, indicating a slight decrease which warrants closer scrutiny by stakeholders.
Payout Ratio
Payout ratios are pivotal in determining whether a company can sustain its dividend payments amid earnings and cash flow variations.
| Key Figure | Ratio |
|---|---|
| EPS-based | 75.76% |
| Free cash flow-based | -87.58% |
An EPS-based payout ratio of 75.76% suggests manageable dividend coverage, whereas a FCF-based ratio of -87.58% indicates cash flow challenges affecting dividend sustainability.
Cashflow & Capital Efficiency
Assessing cash flow and capital efficiency helps understand the underlying financial health and the company's ability to fund operations and dividends.
| Metric | 2024 | 2023 | 2022 |
|---|---|---|---|
| Free Cash Flow Yield | -1.94% | -3.16% | -1.98% |
| Earnings Yield | 3.71% | 3.70% | 3.52% |
| CAPEX to Op. Cash Flow | 135.52% | 135.95% | 124.57% |
| Stock-based Comp. to Revenue | 0.54% | 0.40% | 0.47% |
| FCF / Op. Cash Flow Ratio | -19.87% | -35.95% | -24.57% |
The negative free cash flow yield, coupled with high CAPEX, suggests capital allocation primarily toward investments rather than liquidity generation.
Balance Sheet & Leverage Analysis
Evaluating the balance sheet provides insight into financial stability and the company's leverage potential to manage liabilities and foster growth.
| Metric | 2024 | 2023 | 2022 |
|---|---|---|---|
| Debt-to-Equity | 1.19 | 1.12 | 1.02 |
| Debt-to-Assets | 40.92% | 39.77% | 37.60% |
| Debt-to-Capital | 54.42% | 52.83% | 50.56% |
| Net Debt to EBITDA | 5.14 | 5.22 | 5.21 |
| Current Ratio | 0.86 | 0.88 | 0.75 |
| Quick Ratio | 0.71 | 0.73 | 0.63 |
The progressively higher debt figures could signal risk, but consistent interest coverage mitigates immediate concerns.
Fundamental Strength & Profitability
Key ratios such as RoE and margins are crucial for evaluating profitability and operational efficiency, impacting long-term company viability.
| Metric | 2024 | 2023 | 2022 |
|---|---|---|---|
| Return on Equity | 6.31% | 5.31% | 5.43% |
| Return on Assets | 2.16% | 1.89% | 1.99% |
| Net Margin | 10.49% | 8.90% | 9.57% |
| EBIT Margin | 21.91% | 19.13% | 18.07% |
| EBITDA Margin | 37.95% | 35.19% | 33.68% |
| Research & Development to Revenue | 0% | 0% | 0% |
Profit margins improve, evidencing operational efficiency. Lower R&D spend may affect innovation but aligns with sector norms.
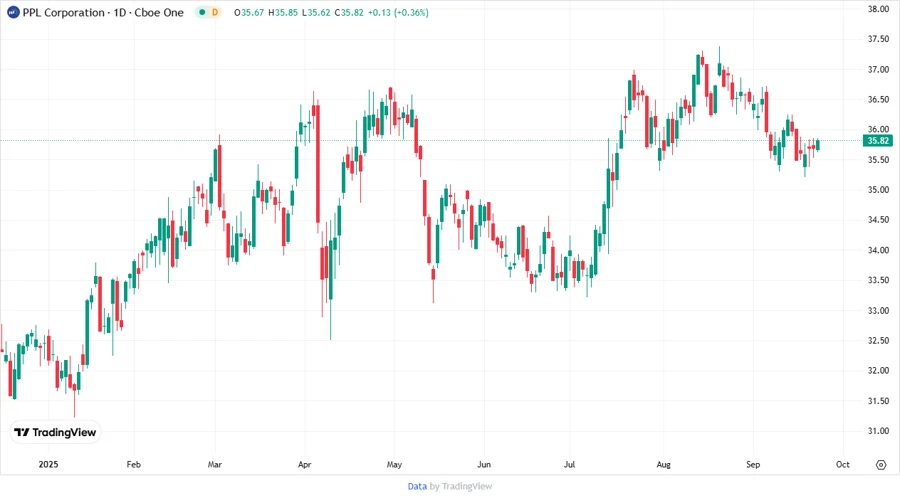
Price Development
Dividend Scoring System
| Category | Score (1-5) | Score Bar |
|---|---|---|
| Dividend yield | 3 | |
| Dividend Stability | 4 | |
| Dividend growth | 2 | |
| Payout ratio | 3 | |
| Financial stability | 3 | |
| Dividend continuity | 4 | |
| Cashflow Coverage | 2 | |
| Balance Sheet Quality | 3 |
Total Score: 24/40
Rating
Given the consistent dividend history but current growth stagnation, cautious optimism is advised. The dividend yield remains attractive; however, potential investors should weigh financial ratios and current profitability trends to mitigate inherent risks.
Smart Data Insight
Master the Perfect Entry & Exit for this Stock
Don't leave your profits to chance. Historically, this stock follows specific seasonal patterns that institutional traders use to maximize returns.
- ✅ Identify the "Golden Buying Window"
- ✅ Avoid high-risk correction cycles
- ✅ Backtested data from the last 20+ years