August 09, 2025 a 11:31 am

PPL: Dividend Analysis - PPL Corporation
PPL Corporation presents a nuanced outlook for dividend investors. Despite a rich history of consistent dividends over 42 years, recent fluctuations in payout ratios and growth patterns mark areas of concern. While maintaining a reasonable dividend yield of 3.14%, potential investors should consider the company's formidable history against current financial metrics.
📊 Overview
The overview of PPL Corporation's dividend characteristics is crucial for potential investors interested in sustainable income.
| Sector | Dividend Yield | Current Dividend Per Share | Dividend History | Last Cut/Suspension |
|---|---|---|---|---|
| Utilities | 3.14% | 1.01 USD | 42 years | None |
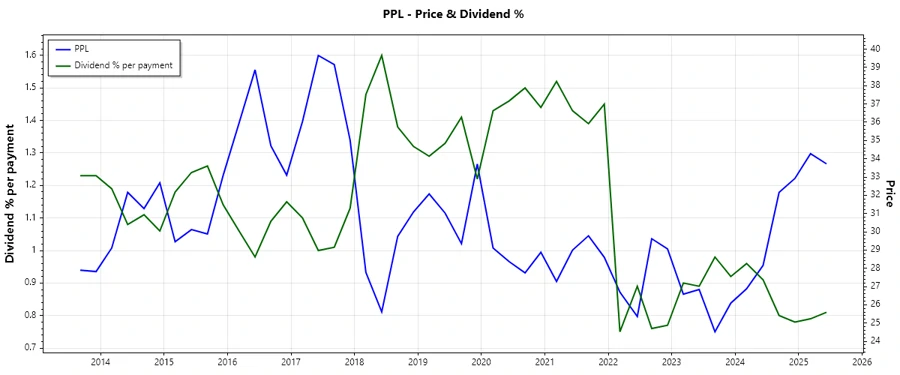
📉 Dividend History
PPL Corporation's historical dividend profile is robust, evidencing a commitment to shareholder returns. This history is a critical factor in its investment appeal, signaling reliability in income provision.
| Year | Dividend Per Share (USD) |
|---|---|
| 2025 | 0.545 |
| 2024 | 1.030 |
| 2023 | 0.960 |
| 2022 | 0.875 |
| 2021 | 1.660 |
📈 Dividend Growth
Analyzing dividend growth helps assess PPL's adaptability and long-term payout sustainability. Recent trends suggest caution with negative growth rates impacting perceived dividend reliability.
| Time | Growth |
|---|---|
| 3 years | -14.71% |
| 5 years | -8.99% |
The average dividend growth is -8.99% over five years, indicating challenges in maintaining historic growth levels.
✅ Payout Ratio
Payout ratios are pivotal in evaluating dividend health, reflecting company profitability and its capacity to sustain payouts in different financial scenarios.
| Key Figure | Ratio |
|---|---|
| EPS-based | 75.76% |
| Free Cash Flow-based | -217.67% |
The 75.76% EPS payout ratio appears manageable; however, the negative FCF payout ratio is concerning, indicating cash flow challenges.
Cashflow & Capital Efficiency
The analysis of cash flow and capital efficiency ratios reveals critical insights into operational health and financial stability, which underpin sustainable dividend practices.
| Year | 2024 | 2023 | 2022 |
|---|---|---|---|
| Free Cash Flow Yield | -1.94% | -3.16% | -1.98% |
| Earnings Yield | 3.71% | 3.70% | 3.52% |
| CAPEX/Operating Cash Flow | 1.20 | 1.36 | 1.25 |
| Stock-based Compensation/Revenue | 0 | 0.40% | 0.47% |
| FREE CASH FLOW/Operating Cash Flow Ratio | -19.87% | -35.95% | -24.57% |
The negative free cash flow yield highlights ongoing fiscal challenges, requiring scrutiny for dividend feasibility.
Balance Sheet & Leverage Analysis
Balance sheet ratios provide a lens to assess financial leverage, debt management, and liquidity, key elements for long-term fiscal security.
| Year | 2024 | 2023 | 2022 |
|---|---|---|---|
| Debt-to-Equity | 1.19 | 1.12 | 1.02 |
| Debt-to-Assets | 0.41 | 0.40 | 0.38 |
| Debt-to-Capital | 0.54 | 0.53 | 0.51 |
| Net Debt to EBITDA | 5.13 | 5.21 | 5.21 |
| Current Ratio | 0.86 | 0.88 | 0.75 |
| Quick Ratio | 0.71 | 0.73 | 0.63 |
| Financial Leverage | 2.92 | 2.82 | 2.72 |
The high debt-to-equity ratio signals substantial leverage, potentially risk-inducing if market conditions shift unfavorably.
Fundamental Strength & Profitability
Evaluating return metrics and margin ratios highlights operational prowess, impacting dividend potential and growth sustainability.
| Year | 2024 | 2023 | 2022 |
|---|---|---|---|
| Return on Equity | 6.31% | 5.31% | 5.43% |
| Return on Assets | 2.16% | 1.89% | 2.00% |
| Net Margin | 10.49% | 8.90% | 9.57% |
| EBIT Margin | 21.91% | 19.13% | 18.01% |
Moderate returns on equity and assets indicate efficient capital use; however, the sustainability of current profitability levels remains under market pressures.
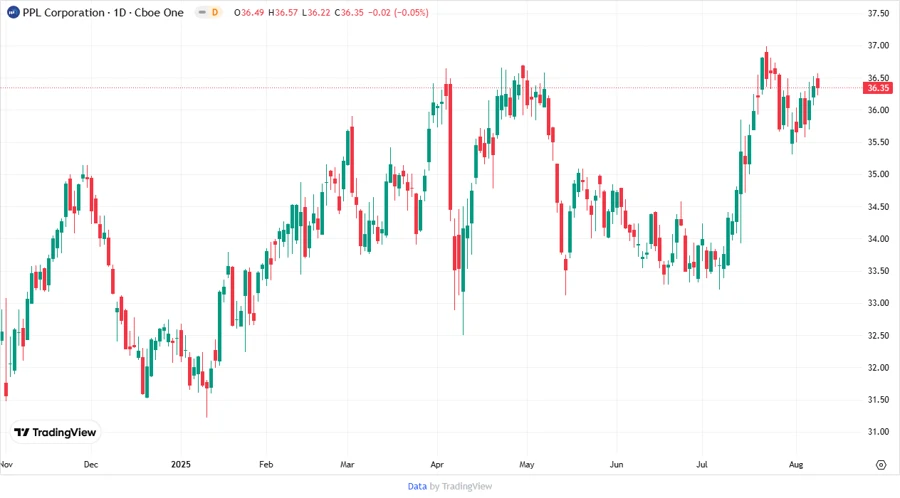
Price Development
Dividend Scoring System
| Category | Score | Bar |
|---|---|---|
| Dividend Yield | 4 | |
| Dividend Stability | 3 | |
| Dividend Growth | 2 | |
| Payout Ratio | 3 | |
| Financial Stability | 3 | |
| Dividend Continuity | 4 | |
| Cashflow Coverage | 2 | |
| Balance Sheet Quality | 3 |
Total Score: 24/40
🗣️ Rating
Based on the comprehensive analysis, PPL Corporation offers a balanced dividend profile with certain risks. Recommendations include a cautious approach, emphasizing historical performance juxtaposed with current fiscal metrics. Ideal for long-term yield-seeking investors willing to manage associated risks.
Smart Data Insight
Master the Perfect Entry & Exit for this Stock
Don't leave your profits to chance. Historically, this stock follows specific seasonal patterns that institutional traders use to maximize returns.
- ✅ Identify the "Golden Buying Window"
- ✅ Avoid high-risk correction cycles
- ✅ Backtested data from the last 20+ years