February 16, 2026 a 04:45 pm

PPG: Fibonacci Analysis - PPG Industries, Inc.
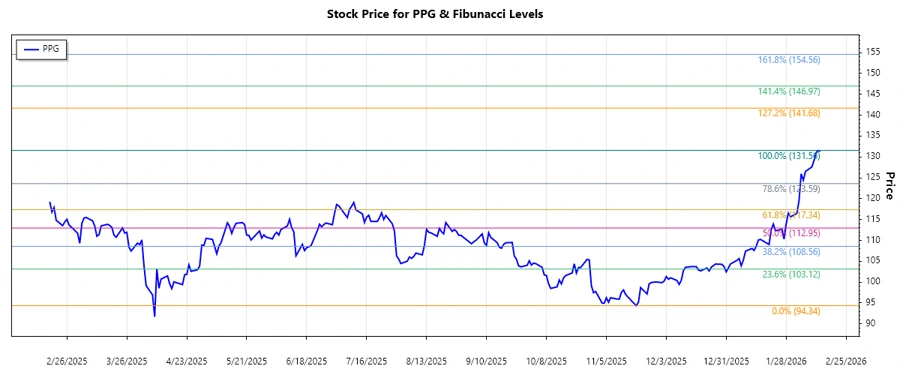
PPG Industries, Inc., a global leader in paints, coatings, and specialty materials, has shown a strong upward momentum. The recent price movements reflect a robust market confidence. Current technical indicators suggest potential continuation of this trend, while investors should stay cautious of any retracement levels.
Fibonacci Analysis
| Detail | Value |
|---|---|
| Trend Start Date | 2025-11-19 |
| Trend End Date | 2026-02-13 |
| Highest Price Date | 2026-02-12 |
| Highest Price | $131.56 |
| Lowest Price Date | 2025-11-19 |
| Lowest Price | $94.34 |
| Fibonacci Level | Price |
|---|---|
| 0.236 | $111.10 |
| 0.382 | $115.91 |
| 0.5 | $119.95 |
| 0.618 | $123.99 |
| 0.786 | $129.01 |
The current price is $131.34, which is above the 0.786 retracement level, suggesting a potential new support has formed around the 0.786 level. Investors can interpret this as a strong support area, where a reversal could occur.
Conclusion
The upward trend in PPG Industries' stock indicates the company's strong market position and investor confidence. While the recent price is above key retracement levels, it presents both an opportunity for continued gains and a risk of retracement. Analysts should closely monitor the stock as it navigates these levels to gauge its potential for sustained growth versus possible pullbacks.