February 12, 2026 a 05:15 am
PPG: Fibonacci Analysis - PPG Industries, Inc.
PPG Industries, Inc., a global leader in paints, coatings, and specialty materials, has experienced a significant price rally recently. The technical outlook shows potential for further gains as the stock has demonstrated resilience amidst general market volatility. Investors should monitor key retracement levels to gauge potential support and resistance areas for future price movements.
Fibonacci Analysis
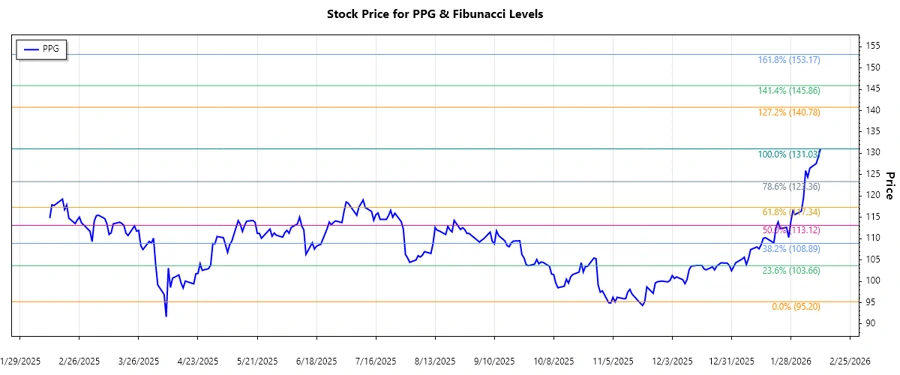
The recent analysis of the stock price data indicates a dominant uptrend starting from November 20, 2025, to February 11, 2026. The identified uptrend has seen the price moving from a low of $95.20 to a high of $131.03. Based on this trend, we have calculated the Fibonacci retracement levels, which are key indicators for potential support and resistance in the future.
| Period | Value |
|---|---|
| Start Date | 2025-11-20 |
| End Date | 2026-02-11 |
| High Point | $131.03 (2026-02-11) |
| Low Point | $95.20 (2025-11-20) |
| Fibonacci Level | Price |
|---|---|
| 0.236 | $121.26 |
| 0.382 | $115.82 |
| 0.5 | $113.12 |
| 0.618 | $110.42 |
| 0.786 | $105.91 |
Currently, the stock is trading near the 0.236 retracement level, suggesting that it is testing a minor support level at this price point. This could signify an opportunity for bulls to continue the uptrend or, if broken, a short-term correction might unfold.
Conclusion
PPG Industries, Inc. presents a promising opportunity for investors as the stock is currently positioned in a potential support area around the 0.236 Fibonacci retracement level. With the overall trend being upward, there exists the possibility for further gains if key support levels hold. However, investors should remain cautious of potential volatility if these levels fail to act as support. The technical indicators suggest that maintaining vigilance at these points will provide critical insights for potential entry or exit strategies.