October 21, 2025 a 04:45 pm
PPG: Fibonacci Analysis - PPG Industries, Inc.
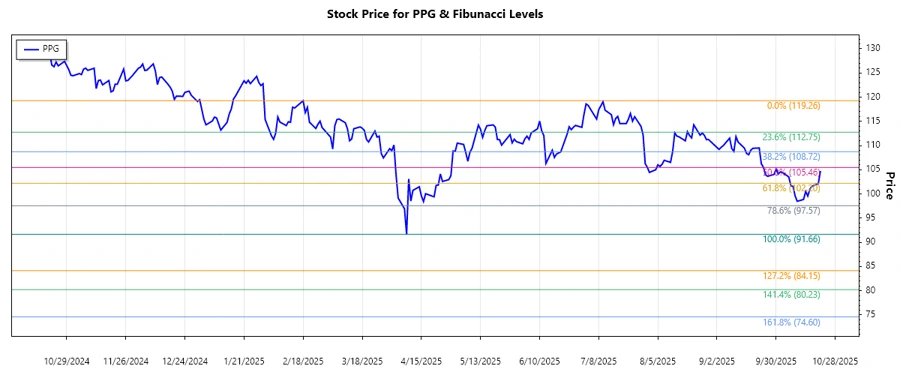
PPG Industries, Inc. experienced a decline in its stock price over the past months, particularly evident from the drop recorded in mid-2025. This downward trend suggests caution for investors, as the stock attempts to stabilize. Monitoring further developments will be crucial for stakeholders to determine potential recovery phases.
Fibonacci Analysis
The following analysis is based on the recent downtrend observed in PPG Industries' stock price.
| Details | Value |
|---|---|
| Start Date | 2025-02-18 |
| End Date | 2025-10-21 |
| Highest Price (Date) | $119.26 (2025-02-18) |
| Lowest Price (Date) | $91.66 (2025-04-08) |
| Fibonacci Level | Price Level |
|---|---|
| 0.236 | $98.59 |
| 0.382 | $102.13 |
| 0.5 | $105.46 |
| 0.618 | $108.79 |
| 0.786 | $113.26 |
As of the latest data, the current price of $104.745 is not within a significant retracement zone.
This region might serve as a support level, indicating a potential stabilization phase, if the price holds above $105.46, a critical Fibonacci level being tested.
Conclusion
The recent data suggests that PPG Industries, Inc. is experiencing a prolonged decrease in value, with tentative signs of stabilization. Key Fibonacci levels hint at potential support areas, offering investors insight into possible recovery points. However, market volatility and broader economic constraints can impact these technical predictions. Strategic entry and exit points should consider these Fibonacci levels, ensuring informed financial decisions. Stakeholders are encouraged to remain vigilant and responsive to further stock movements.
Smart Data Insight
Master the Perfect Entry & Exit for this Stock
Don't leave your profits to chance. Historically, this stock follows specific seasonal patterns that institutional traders use to maximize returns.
- ✅ Identify the "Golden Buying Window"
- ✅ Avoid high-risk correction cycles
- ✅ Backtested data from the last 20+ years