June 04, 2025 a 11:44 am

PPG: Fibonacci Analysis - PPG Industries, Inc.
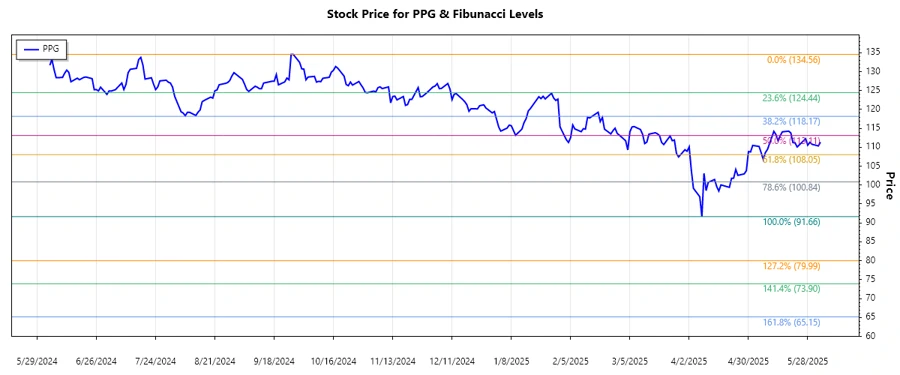
PPG Industries, Inc. stands as a prominent entity in the coatings and specialty materials industry globally. Recently, the stock has shown a significant downtrend over the past months, reflecting broader market sentiments and company-specific factors. Understanding the recent trend is crucial for potential investors and current stakeholders alike, as it may present opportunities for strategic entry or risk management.
Fibonacci Analysis
| Trend Details | Value |
|---|---|
| Start Date | 2024-06-04 |
| End Date | 2025-06-03 |
| High Point (Price & Date) | $134.56 on 2024-09-27 |
| Low Point (Price & Date) | $91.66 on 2025-04-08 |
| Fibonacci Level | Price Level |
|---|---|
| 0.236 | $101.35 |
| 0.382 | $108.35 |
| 0.5 | $113.11 |
| 0.618 | $117.87 |
| 0.786 | $124.10 |
The current price of $111.37 appears to be within the 0.382 Fibonacci retracement zone. This level may serve as a potential resistance point, suggesting cautious optimism as the stock attempts to regain upward momentum.
Should this retracement level hold, it could indicate strong support, creating potential buying opportunities.
Conclusion
The current analysis indicates PPG Industries, Inc. is undergoing a potential recovery phase from its recent downtrend. Investors should watch the $108 to $113 range closely, as these levels could serve as pivotal support and resistance zones. However, considering the market's volatility, it's crucial to stay informed about factors influencing the stock, such as industry shifts and macroeconomic variables. The Fibonacci levels outlined here can provide a framework for strategic decision-making, balancing potential gains against inherent risks.
Smart Data Insight
Master the Perfect Entry & Exit for this Stock
Don't leave your profits to chance. Historically, this stock follows specific seasonal patterns that institutional traders use to maximize returns.
- ✅ Identify the "Golden Buying Window"
- ✅ Avoid high-risk correction cycles
- ✅ Backtested data from the last 20+ years