
May 31, 2026 a 03:31 am

PPG: Dividend Analysis - PPG Industries, Inc.
PPG Industries, Inc., with its longstanding history and stable dividend payout, presents an appealing proposition for dividend-focused investors. The company's dedication to maintaining dividend continuity over decades have solidified investor confidence. However, potential investors should remain conscious of market fluctuations and the potential impacts on future payouts.
📊 Overview
The overview of PPG Industries, Inc. illustrates a strong history of consistent dividend payouts. This stability, alongside a current yield of 2.63%, highlights the attractiveness of the stock for income-seeking investors. PPG Industries has a commendable record with 44 years of uninterrupted dividend payments, indicating a robust financial position and commitment to shareholder returns.
| Metric | Value |
|---|---|
| Sector | Basic Materials |
| Dividend yield | 2.63% |
| Current dividend per share | 2.78 USD |
| Dividend history | 44 years |
| Last cut or suspension | None |
📈 Dividend History
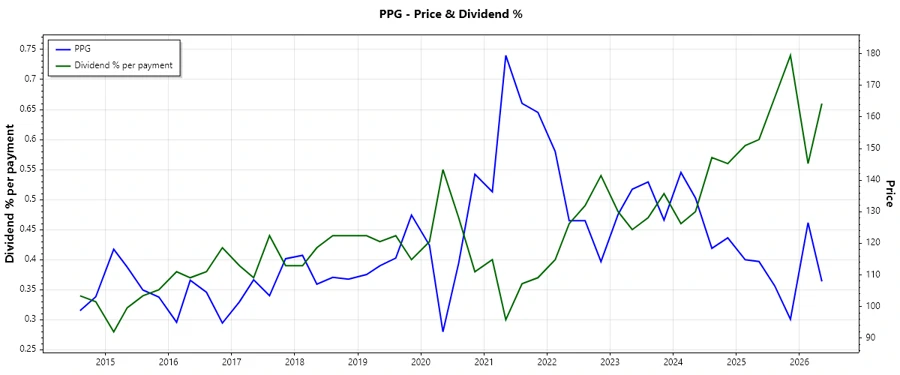
PPG Industries' dividend history showcases its commitment to stable returns, crucial in assessing its future dividend-paying potential. The company's ability to maintain and grow dividends over the years instills confidence in its financial infrastructure.
| Year | Dividend per Share (USD) |
|---|---|
| 2026 | 1.42 |
| 2025 | 2.78 |
| 2024 | 2.66 |
| 2023 | 2.54 |
| 2022 | 2.42 |
🔍 Dividend Growth
Dividend growth is a key indicator of a company's ability to enhance shareholder value over time, offering insights into its financial health and long-term prospects. PPG's 5-year growth rate exemplifies its moderate yet consistent capacity for generating increasing returns.
| Time | Growth |
|---|---|
| 3 years | 4.73% |
| 5 years | 5.77% |
The average dividend growth is 5.77% over 5 years. This shows moderate but steady dividend growth.
🗣️ Payout Ratio
A payout ratio analysis inspects how comfortably a company can maintain its current dividends. With an EPS-based payout of 39.17% and an FCF payout of 50.41%, PPG demonstrates a sustainable balance in rewarding shareholders while retaining sufficient capital for growth and operations.
| Key figure ratio | Value |
|---|---|
| EPS-based | 39.17% |
| Free cash flow-based | 50.41% |
The payout ratios suggest a healthy payout policy, balancing returns to shareholders with reinvestment in business growth.
📈 Cashflow & Capital Efficiency
Cashflow and capital efficiency metrics are pivotal indicators of a company's financial robustness and operational efficacy. PPG exhibits strong earnings and free cash yields, revealing its capability to generate cashflow effectively while maintaining competitive capex ratios.
| Year | 2023 | 2024 | 2025 |
|---|---|---|---|
| Free Cash Flow Yield | 5.37% | 2.50% | 5.02% |
| Earnings Yield | 3.60% | 3.99% | 6.80% |
| CAPEX to Operating Cash Flow | 21.40% | 50.77% | 40.08% |
| Stock-based Compensation to Revenue | 0.34% | 0.27% | 0.15% |
| Free Cash Flow / Operating Cash Flow Ratio | 78.60% | 49.23% | 59.92% |
PPG's consistency in cashflow metrics is indicative of its resilient operating model and disciplined capital management strategy.
🗣️ Balance Sheet & Leverage Analysis
The balance sheet and leverage metrics provide insight into a company's financial stability and debt management strategies. PPG's low debt-equity ratio and strong current ratio emphasize its sound liquidity position, lowering the financial risk for investors.
| Year | 2023 | 2024 | 2025 |
|---|---|---|---|
| Debt-to-Equity | 0.84 | 0.94 | -2.10 |
| Debt-to-Assets | 30.48% | 32.91% | 93.55% |
| Debt-to-Capital | 45.73% | 48.52% | 190.78% |
| Net Debt to EBITDA | 2.08 | 1.99 | 1.88 |
| Current Ratio | 1.47 | 1.31 | 1.62 |
| Quick Ratio | 1.09 | 0.94 | 1.22 |
| Financial Leverage | 2.76 | 2.86 | -2.25 |
PPG's leverage metrics highlight prudent debt management and liquidity maintenance, bolstering overall financial stability.
✅ Fundamental Strength & Profitability
An analysis of profitability and fundamental metrics indicates the effectiveness of a company's operational framework. PPG's strong ROE and margin figures signify efficient use of capital and a robust profit generation mechanism.
| Year | 2023 | 2024 | 2025 |
|---|---|---|---|
| Return on Equity | 16.22% | 16.45% | -44.48% |
| Return on Assets | 5.87% | 5.74% | 19.80% |
| Margins: Net | 7.82% | 7.04% | 9.93% |
| Margins: EBIT | 11.93% | 13.21% | 14.40% |
| Margins: EBITDA | 15.91% | 16.31% | 17.73% |
| Margins: Gross | 40.41% | 41.61% | 37.99% |
| Research & Development to Revenue | 2.61% | 2.67% | 2.66% |
PPG's profitability metrics underscore robust operational control and optimal resource utilization, fostering competitive advantage.
📉 Price Development
🏅 Dividend Scoring System
| Criteria | Score | Score Bar |
|---|---|---|
| Dividend yield | 4 | |
| Dividend Stability | 5 | |
| Dividend growth | 3 | |
| Payout ratio | 5 | |
| Financial stability | 4 | |
| Dividend continuity | 5 | |
| Cashflow Coverage | 4 | |
| Balance Sheet Quality | 4 |
Total Score: 34/40
🗣️ Rating
With a commendable dividend history, stable growth prospects, and solid financial ratios, PPG Industries, Inc. offers a reliable and attractive option for dividend-seeking investors. The company's proactive financial management and consistent dividend strategy ensure a favorable outlook for sustainable income generation. Investors might consider PPG as a long-term investment choice with moderate risks and promising returns.
Smart Data Insight
Master the Perfect Entry & Exit for this Stock
Don't leave your profits to chance. Historically, this stock follows specific seasonal patterns that institutional traders use to maximize returns.
- ✅ Identify the "Golden Buying Window"
- ✅ Avoid high-risk correction cycles
- ✅ Backtested data from the last 20+ years