October 20, 2025 a 03:15 am
POOL: Trend and Support & Resistance Analysis - Pool Corporation
The recent analysis of Pool Corporation's stock shows a dynamic interplay between its moving averages, suggesting market volatility. The pool industry has been thriving, and with the company's expansive reach in North America, Europe, and Australia, it has maintained a significant market presence. Close attention to technical indicators, like EMAs, can guide investors in making informed decisions.
Trend Analysis
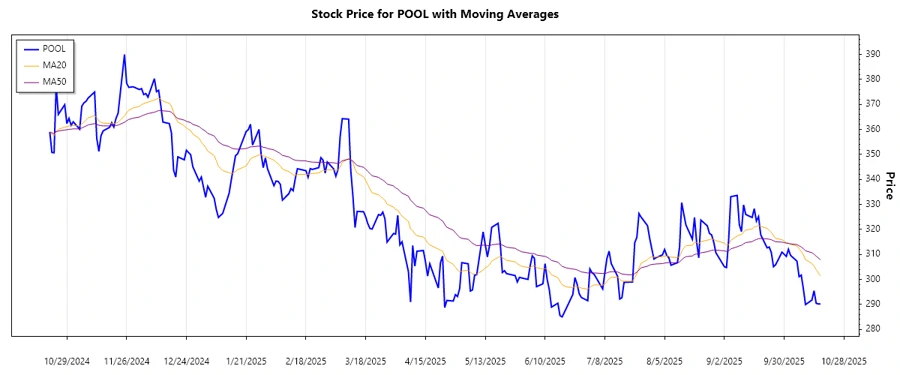
The analysis based on the given daily closing prices indicates that the trend for Pool Corporation in the last month can be primarily seen as a ▼ Abwärtstrend. This is established by a consistent pattern of EMA20 being below EMA50.
| Date | Close Price | Trend |
|---|---|---|
| 2025-10-17 | 290.21 | ▼ |
| 2025-10-16 | 290.17 | ▼ |
| 2025-10-15 | 290.44 | ▼ |
| 2025-10-14 | 295.46 | ▼ |
| 2025-10-13 | 291.73 | ▼ |
| 2025-10-10 | 289.91 | ▼ |
| 2025-10-09 | 296.24 | ▲ |
In conclusion, the EMA analysis suggests a predominant downward trend due to EMA20 consistently being below EMA50, indicating bearish market sentiments.
Support and Resistance
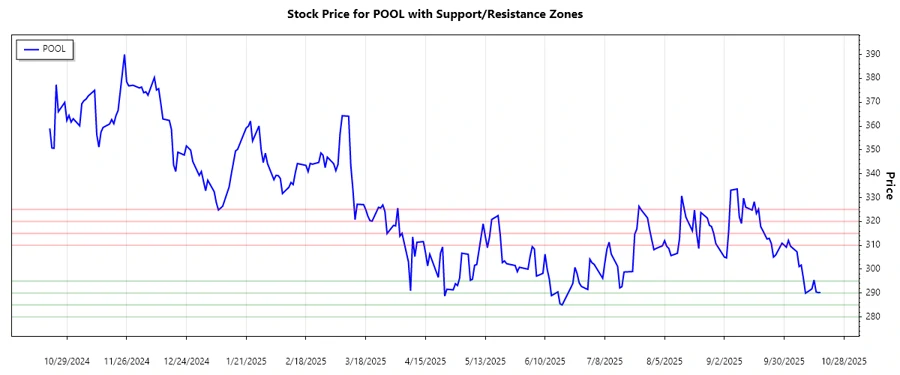
Based on the recent price actions, two significant support and resistance zones have been identified. These levels mark potential reversal areas where the price could change direction.
| Zone Type | From | To |
|---|---|---|
| Support | 280 | 285 |
| Support | 290 | 295 |
| Resistance | 310 | 315 |
| Resistance | 320 | 325 |
Currently, the stock is trading near its second support zone (290 - 295), suggesting it could soon test this level for a potential bounce back. If this level holds, a potential bullish reversal might occur, but if broken, it may signal further decline.
Conclusion
Pool Corporation's stock has shown a weakening trend recently, with significant support soon to be tested. While the current bearish sentiment dominates, the strength of the support zones could serve as a launchpad for bullish movements. However, breaking the supports could lead to increased downside risk. For analysts, the mixed signals necessitate a cautious approach with close monitoring of trading volumes and external market factors.