
June 20, 2026 a 11:31 am

POOL: Dividend Analysis - Pool Corporation
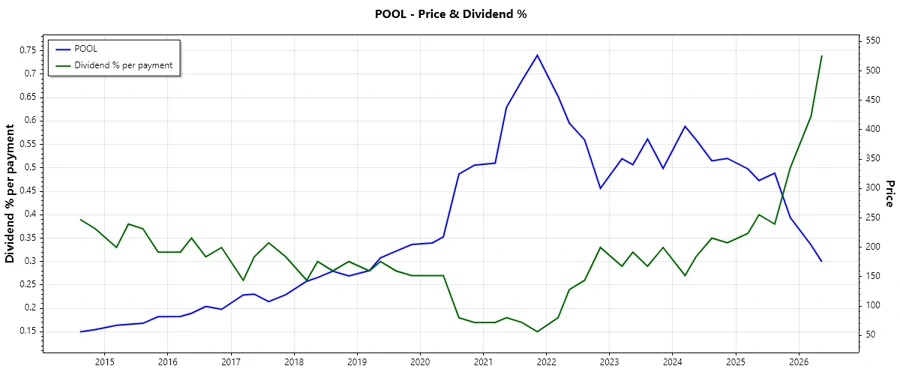
Pool Corporation exhibits a solid dividend profile characterized by consistent growth and a reasonable payout ratio. The company's strategic financial management has resulted in stable dividend yields and strong cash flow coverage. Investors can expect steady dividend income with opportunities for growth, given Pool Corporation's robust financial health and market position.
📊 Overview
Pool Corporation operates in the industrial sector, providing reliable income through dividends with a current yield of 2.88%. The company has sustained a dividend growth for 23 years, showcasing strong dividend history and commitment to its shareholders.
| Sector | Dividend Yield (%) | Current Dividend per Share (USD) | Dividend History (Years) | Last Cut or Suspension |
|---|---|---|---|---|
| Industrial | 2.88 | 4.98 | 23 | None |
🗣️ Dividend History
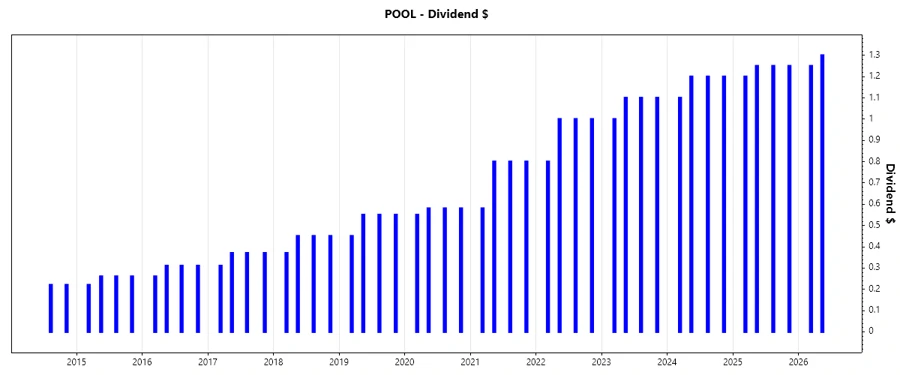
Understanding dividend history is crucial for evaluating the consistency of returns to investors. Pool Corporation’s dividends over the last 5 years reflect stability, an important factor for risk-averse investors.
| Year | Dividend per Share (USD) |
|---|---|
| 2026 | 2.55 |
| 2025 | 4.95 |
| 2024 | 4.7 |
| 2023 | 4.3 |
| 2022 | 3.8 |
📈 Dividend Growth
The dividend growth rate is a key measure of a company’s ability to increase payouts over time, demonstrating strength and sustainability of earnings. Pool Corporation has shown a modest growth rate, indicating positive momentum in dividend improvements.
| Time | Growth (%) |
|---|---|
| 3 years | 9.21 |
| 5 years | 16.67 |
The average dividend growth is 16.67% over 5 years. This shows moderate but steady dividend growth.
✅ Payout Ratio
Payout ratios are indicative of dividend sustainability, revealing the portion of earnings paid out as dividends. Pool Corporation maintains a balanced approach with an EPS payout ratio of 44.57% and an FCF payout ratio of 29.98%.
| Key Figure | Ratio (%) |
|---|---|
| EPS-based | 44.57 |
| Free cash flow-based | 29.98 |
These figures suggest a balanced payout strategy, maintaining sufficient earnings retention for growth while providing reliable dividends to shareholders.
📉 Cashflow & Capital Efficiency
The analysis of cash flow metrics provides insight into Pool Corporation's ability to generate cash versus its capital expenditures. These indicators determine the company’s capacity to fund dividends without jeopardizing operational integrity.
| Year | 2025 | 2024 | 2023 |
|---|---|---|---|
| Free Cash Flow Yield | 3.64 | 4.63 | 5.37 |
| Earnings Yield | 4.78 | 3.35 | 3.39 |
| CAPEX to Operating Cash Flow | 15.4 | 9.02 | 6.77 |
| Stock-based Compensation to Revenue | 0.42 | 0 | 0 |
| Free Cash Flow / Operating Cash Flow Ratio | 84.6 | 90.98 | 93.23 |
The strong cash flow coverage affirms Pool Corporation's financial stability and supports its dividend policy, enhancing investor confidence in the company's capital efficiency.
🧮 Balance Sheet & Leverage Analysis
Balance sheet metrics such as leverage ratios highlight a company's financial structure and debt management. Pool Corporation's efficient debt management reflects prudent financial practices.
| Year | 2025 | 2024 | 2023 |
|---|---|---|---|
| Debt-to-Equity | 129.5 | 99.88 | 103.9 |
| Debt-to-Assets | 42.33 | 37.76 | 39.8 |
| Debt-to-Capital | 56.43 | 49.97 | 50.97 |
| Net Debt to EBITDA | 2.26 | 1.8 | 1.65 |
| Current Ratio | null | null | null |
| Quick Ratio | 58.52 | 52.1 | 58.37 |
| Financial Leverage | 305.9 | 264.5 | 261.1 |
Given the firm capital structure and manageable leverage ratios, Pool Corporation exhibits strong financial stability, reducing the risk of financial distress.
🔎 Fundamental Strength & Profitability
These metrics are vital indicators of a company's overall operational efficiency and profit generation potential. Pool Corporation's robust performance across these parameters underscores its profitability strength.
| Year | 2025 | 2024 | 2023 |
|---|---|---|---|
| Return on Equity | 34.29 | 34.11 | 39.86 |
| Return on Assets | 11.21 | 12.89 | 15.26 |
| Margins: Net | 7.68 | 8.18 | 9.44 |
| Margins: EBIT | 10.97 | 11.62 | 13.47 |
| Margins: EBITDA | 11.94 | 12.48 | 14.2 |
| Margins: Gross | 29.73 | 29.66 | 29.96 |
| Research & Development to Revenue | 0 | 0 | 0 |
High profitability margins complement Pool Corporation's robust financial performance, underlining its efficiency and earnings quality in the market setting.
🕒 Price Development
📊 Dividend Scoring System
| Criterion | Score | Bar |
|---|---|---|
| Dividend Yield | 4 | |
| Dividend Stability | 5 | |
| Dividend Growth | 4 | |
| Payout Ratio | 5 | |
| Financial Stability | 5 | |
| Dividend Continuity | 5 | |
| Cashflow Coverage | 4 | |
| Balance Sheet Quality | 5 |
Overall Score: 37 / 40
🏆 Rating
Pool Corporation demonstrates exemplary financial strength, evidenced by its consistent dividend performance and robust financial metrics. With a score of 37 out of 40 in the dividend scoring system, Pool Corporation is a highly attractive holding for dividend investors seeking reliability and growth potential. I recommend considering Pool Corporation for a diversified dividend-focused portfolio given its sound financial stability and continued commitment to shareholder returns.
Smart Data Insight
Master the Perfect Entry & Exit for this Stock
Don't leave your profits to chance. Historically, this stock follows specific seasonal patterns that institutional traders use to maximize returns.
- ✅ Identify the "Golden Buying Window"
- ✅ Avoid high-risk correction cycles
- ✅ Backtested data from the last 20+ years