September 01, 2025 a 02:47 am


📊 POOL: Dividend Analysis - Pool Corporation
As a leading company, Pool Corporation demonstrates a strong dividend history indicating reliability in dividend continuity. With a reasonable payout ratio, the potential for steady growth in shareholder returns is evident. Examining key financial metrics yields insights into both current performance and future profitability prospects.
Overview
Pool Corporation operates in the industrial sector, known for its consistent dividend payments over the years. Key figures are evaluated to understand its dividend policy better.
| Metric | Value |
|---|---|
| Sector | Industrial |
| Dividend Yield | 1.50 % |
| Current Dividend Per Share | 4.73 USD |
| Dividend History | 22 years |
| Last Cut or Suspension | None |
Dividend History
The dividend history of Pool Corporation underscores its commitment to returning value to shareholders. A continuous increase in dividends showcases financial stability and management's confidence in future cash flows.
| Year | Dividend Per Share (USD) |
|---|---|
| 2025 | 3.70 |
| 2024 | 4.70 |
| 2023 | 4.30 |
| 2022 | 3.80 |
| 2021 | 2.98 |
Dividend Growth
Examining the dividend growth over three and five years reveals a modest yet steady increase. This is a crucial indicator of the company's commitment to enhancing shareholder value.
| Time | Growth |
|---|---|
| 3 years | 16.40 % |
| 5 years | 17.48 % |
The average dividend growth is 17.48% over 5 years. This shows moderate but steady dividend growth.
Payout Ratio
The payout ratio is a vital metric to assess dividend sustainability. Pool Corporation maintains a balanced payout approach, indicating room for potential dividend increases.
| Key Figure | Ratio |
|---|---|
| EPS-based | 42.88 % |
| Free Cash Flow-based | 40.68 % |
The company displays a manageable EPS-based payout ratio of 42.88%, suggesting that earnings comfortably cover dividend payouts. Similarly, the FCF-based ratio of 40.68% denotes fiscal prudence.
Cashflow & Capital Efficiency
Analyzing cash flow metrics sheds light on capital allocation efficiency and liquidity. Pool Corporation exhibits solid cash conversion, supporting its dividend policy.
| Year | 2022 | 2023 | 2024 |
|---|---|---|---|
| Free Cash Flow Yield | 3.70 % | 5.37 % | 4.63 % |
| Earnings Yield | 6.28 % | 3.39 % | 3.35 % |
| CAPEX to Operating Cash Flow | 8.99 % | 6.77 % | 9.02 % |
| Stock-based Compensation to Revenue | 0.24 % | 0.35 % | 0.36 % |
| Free Cash Flow / Operating Cash Flow Ratio | 91 % | 93 % | 91 % |
The solid Free Cash Flow Yield and Earnings Yield indicate efficiency in generating cash, aiding in maintaining its dividend strategy.
Balance Sheet & Leverage Analysis
Examining the balance sheet highlights leverage use and financial resilience. The metrics suggest Pool Corporation leverages fair debt levels while keeping liquidity ratios above industry norms.
| Year | 2022 | 2023 | 2024 |
|---|---|---|---|
| Debt-to-Equity | 1.34 | 1.04 | 1.00 |
| Debt-to-Assets | 46.58 % | 39.80 % | 37.76 % |
| Debt-to-Capital | 57.35 % | 50.97 % | 49.97 % |
| Net Debt to EBITDA | 1.52 | 1.65 | 1.80 |
| Current Ratio | 2.99 | 2.36 | 2.05 |
| Quick Ratio | 0.63 | 0.58 | 0.52 |
| Financial Leverage | 2.89 | 2.61 | 2.64 |
Maintaining manageable Debt leverage levels and robust liquidity positions Pool Corporation strongly for future financial flexibility.
Fundamental Strength & Profitability
In-depth analysis of profitability metrics provides insights into operational efficiency. High returns on equity and assets reflect positively on management effectiveness.
| Year | 2022 | 2023 | 2024 |
|---|---|---|---|
| Return on Equity | 60.59 % | 39.86 % | 34.11 % |
| Return on Assets | 21.00 % | 15.26 % | 12.90 % |
| Margins: Net | 12.11 % | 9.44 % | 8.18 % |
| EBIT Margin | 16.60 % | 13.47 % | 11.62 % |
| EBITDA Margin | 17.23 % | 14.20 % | 12.48 % |
| Gross Margin | 31.29 % | 29.96 % | 29.66 % |
| Research & Development to Revenue | 0 % | 0 % | 0 % |
The diversity in margins substantiates Pool Corporation's operational resilience amid varying economic conditions. Returns on Equity are notably strong, underscoring effectiveness in capital utilization.
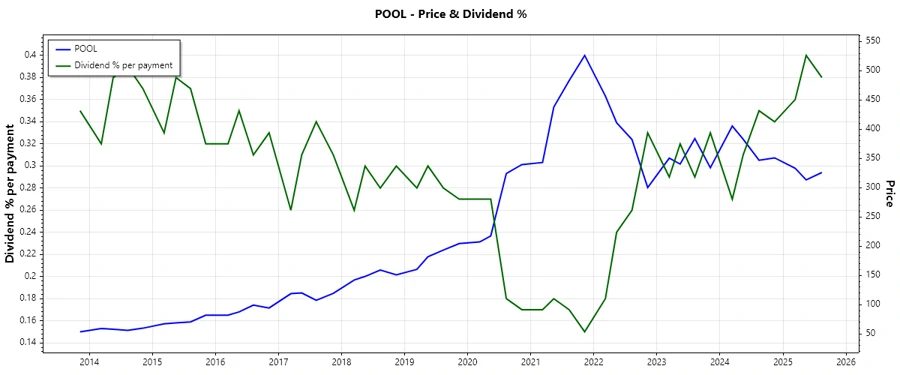
📈 Price Development
Dividend Scoring System
| Criterion | Score | Visual |
|---|---|---|
| Dividend Yield | 3/5 | |
| Dividend Stability | 5/5 | |
| Dividend Growth | 4/5 | |
| Payout Ratio | 4/5 | |
| Financial Stability | 4/5 | |
| Dividend Continuity | 5/5 | |
| Cashflow Coverage | 4/5 | |
| Balance Sheet Quality | 4/5 |
Overall Dividend Score: 33/40
Rating
Pool Corporation exhibits robust financial metrics and a reliable dividend history, affirming its status as a prudent investment for income-seeking investors. While dividend yield is modest, consistent growth and strong payout ratios suggest potential for enhanced returns. The stock is recommended as a viable option for balanced portfolio diversification.
Smart Data Insight
Master the Perfect Entry & Exit for this Stock
Don't leave your profits to chance. Historically, this stock follows specific seasonal patterns that institutional traders use to maximize returns.
- ✅ Identify the "Golden Buying Window"
- ✅ Avoid high-risk correction cycles
- ✅ Backtested data from the last 20+ years