June 02, 2025 a 02:46 am

📊 POOL: Dividend Analysis - Pool Corporation
Pool Corporation presents a unique blend of steady revenue streams and a well-maintained dividend policy. With 22 years of consistent dividend payments and a moderate yield, POOL represents a stable choice for income-focused investors. The company's financial health, characterized by a moderate payout ratio and robust cash flow, underscores its reliability in delivering shareholder returns. In addition, historical dividend growth and the absence of recent cuts or suspensions highlight POOL's commitment to long-term investor value.
Overview
POOL operates within a dynamic sector, showcasing resilience and strength in its financial strategy. Its moderate dividend yield of 1.55% and a substantial dividend history of 22 years form a solid foundation for investors seeking stable returns. The firm's current dividend per share stands at 4.73 USD, with no recent cuts or suspensions, reflecting sound management practices.
| Attribute | Value |
|---|---|
| Sector | Consumer Discretionary |
| Dividend yield | 1.55% |
| Current dividend per share | 4.73 USD |
| Dividend history | 22 years |
| Last cut or suspension | None |
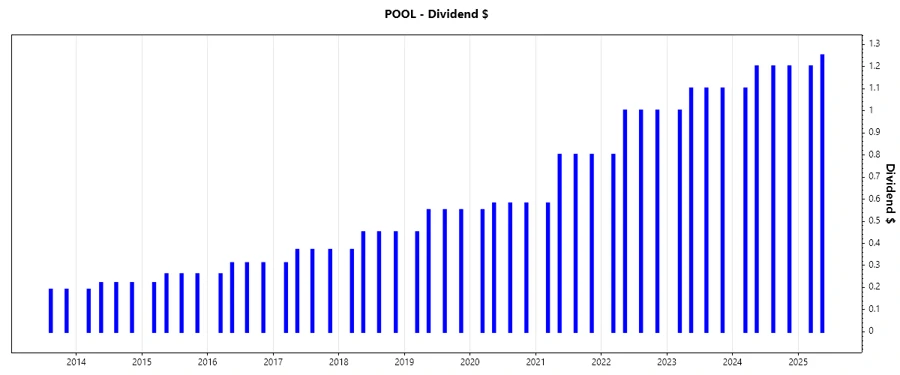
Dividend History
The extensive dividend history of Pool Corporation is a testament to its stable performance over decades. Maintaining dividend consistency without reductions strengthens investor confidence and provides income predictability, which is crucial for retirement planning and long-term investment strategies.
| Year | Dividend per Share (USD) |
|---|---|
| 2025 | 2.45 |
| 2024 | 4.7 |
| 2023 | 4.3 |
| 2022 | 3.8 |
| 2021 | 2.98 |
Dividend Growth
Observing the dividend growth trajectory provides insight into a company's operational success and strategic financial planning. POOL's 5-year average dividend growth rate of 17.48% indicates continuous and accelerating dividend payments, despite macroeconomic fluctuations. This growth further foxifies its preeminence as a reliable dividend player.
| Time | Growth |
|---|---|
| 3 years | 16.40% |
| 5 years | 17.48% |
The average dividend growth is 17.48% over 5 years. This shows moderate but steady dividend growth.
Payout Ratio
The payout ratio is a critical marker of a company’s dividend sustainability. POOL maintains an EPS-based payout ratio of 43.29% and a free cash flow-based payout ratio of 36.62%, indicating ample room for dividend coverage and future increases. The balance struck by these metrics highlights an adept alignment of investor returns with reinvestment and growth.
| Key Figure | Ratio |
|---|---|
| EPS-based | 43.29% |
| Free cash flow-based | 36.62% |
With a controlled EPS payout and solid FCF coverage, POOL evidences prudential measures in dividend disbursement, ensuring continued shareholder satisfaction without capital constraints.
Cashflow & Capital Efficiency
Understanding a company's cash flow dynamics and capital efficiency metrics provides a comprehensive view of its operational health. POOL’s consistent free cash flow yield highlights its capability to generate liquidity, allowing for continued dividend support and investments in future growth strategies.
| Metric | 2024 | 2023 | 2022 |
|---|---|---|---|
| Free Cash Flow Yield | 4.63% | 5.37% | 3.70% |
| Earnings Yield | 3.35% | 3.39% | 6.28% |
| CAPEX to Operating Cash Flow | 9.02% | 6.77% | 8.99% |
| Stock-based Compensation to Revenue | 0.36% | 0.35% | 0.24% |
| Free Cash Flow / Operating Cash Flow Ratio | 91% | 93% | 91% |
| Return on Invested Capital | 17.69% | 20.39% | 25.42% |
The sustained high levels in free cash flow yield and operating cash flow ratios reflect superior capital efficiency and fiscal prudence, ensuring ongoing strategic expansion without jeopardizing liquidity.
Balance Sheet & Leverage Analysis
A robust balance sheet is essential for evaluating long-term viability, especially in volatile markets. POOL demonstrates a strong balance sheet with a healthy debt-to-equity ratio, underscoring its commitment to maintaining a conservative leverage profile. This strategy stabilizes its financial posture while allowing responsive capital allocation based on market dynamics.
| Metric | 2024 | 2023 | 2022 |
|---|---|---|---|
| Debt-to-Equity | 0.9988 | 1.0394 | 1.3446 |
| Debt-to-Assets | 37.76% | 39.80% | 46.58% |
| Debt-to-Capital | 49.97% | 50.97% | 57.35% |
| Net Debt to EBITDA | 1.80 | 1.65 | 1.52 |
| Current Ratio | 2.048 | 2.355 | 2.988 |
| Quick Ratio | 0.521 | 0.584 | 0.633 |
| Financial Leverage | 2.645 | 2.611 | 2.887 |
POOL’s debt metrics suggest a measured approach to leveraging, giving it the flexibility to weather economic pressures while providing a safeguard against potential risks.
Fundamental Strength & Profitability
Profitability and fundamental strength are pivotal to understanding a company’s competitive positioning and its ability to reap returns on investment. POOL showcases robust profitability ratios backed by efficient operations, contributing positively to its long-term capital growth potential.
| Metric | 2024 | 2023 | 2022 |
|---|---|---|---|
| Return on Equity | 34.11% | 39.86% | 60.59% |
| Return on Assets | 12.89% | 15.26% | 20.99% |
| Margins: Net | 8.18% | 9.44% | 12.11% |
| Margins: EBIT | 11.62% | 13.47% | 16.60% |
| Margins: EBITDA | 12.48% | 14.20% | 17.23% |
| Margins: Gross | 29.66% | 29.96% | 31.29% |
| Research & Development to Revenue | 0% | 0% | 0% |
With strong margins and high return on equity, POOL epitomizes efficiency and value creation. The absence of R&D expenses denotes a focus on operationalizing existing markets effectively.
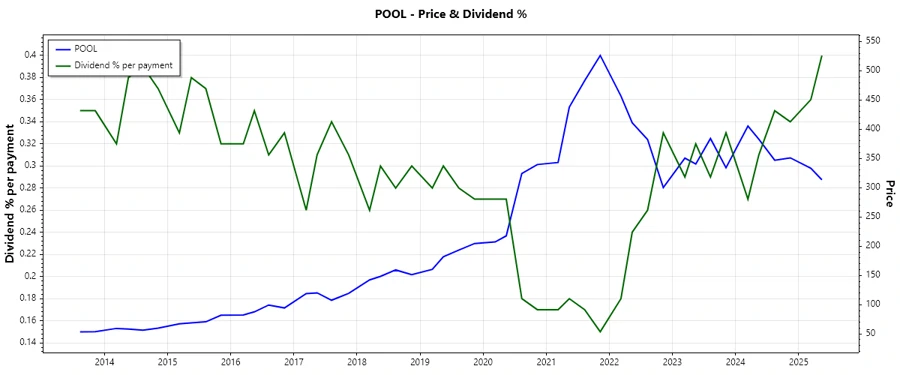
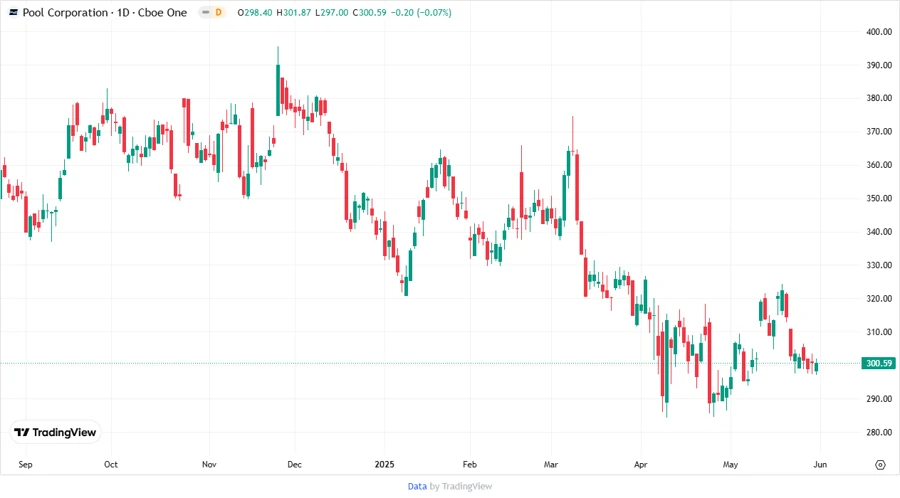
Price Development
Dividend Scoring System
| Category | Score | Representation |
|---|---|---|
| Dividend yield | 4 | |
| Dividend Stability | 5 | |
| Dividend growth | 4 | |
| Payout ratio | 5 | |
| Financial stability | 4 | |
| Dividend continuity | 5 | |
| Cashflow Coverage | 4 | |
| Balance Sheet Quality | 5 |
Overall Score: 36/40
Rating
In conclusion, POOL Corporation presents an appealing prospect for dividend-focused investors. With solid metrics in dividend continuity, growth, and financial stability, it stands out as a robust candidate for long-term portfolio inclusion. While its yield is modest, the dividend policy's dependability provides reassurance. Further evaluation of market conditions and company responses will be beneficial, but POOL remains a strong buy in the dividend echelons.
Smart Data Insight
Master the Perfect Entry & Exit for this Stock
Don't leave your profits to chance. Historically, this stock follows specific seasonal patterns that institutional traders use to maximize returns.
- ✅ Identify the "Golden Buying Window"
- ✅ Avoid high-risk correction cycles
- ✅ Backtested data from the last 20+ years