
June 23, 2026 a 01:15 pm

PODD: Trend and Support & Resistance Analysis - Insulet Corporation
The recent price analysis of Insulet Corporation indicates a substantial shift. While the company remains a leader in insulin management systems, its stock has faced volatility. Understanding the trend dynamics and key support and resistance zones is crucial for strategic investment decisions.
Trend Analysis
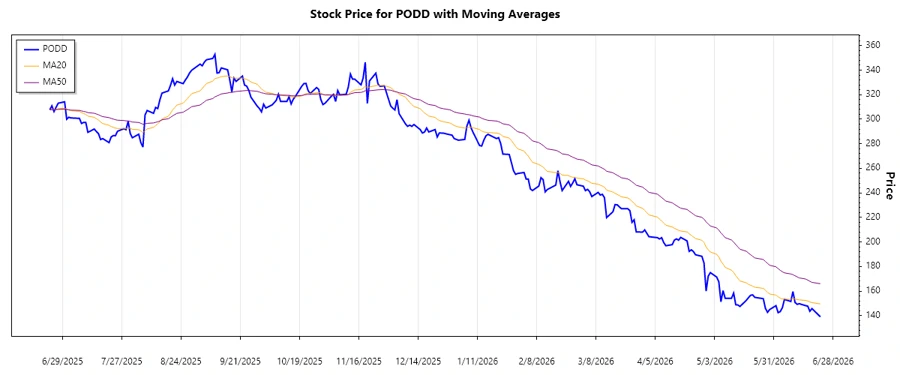
The latest trend analysis reveals that the stock has been experiencing more of a ▲ uptrend, though recent data suggests potential fluctuations. Let us examine the EMA indicators to identify the prevailing trend accurately.
| Date | Close Price | Trend |
|---|---|---|
| 2026-06-22 | 138.97 | ▲ |
| 2026-06-18 | 145.76 | ▼ |
| 2026-06-17 | 143.52 | ▼ |
| 2026-06-16 | 147.69 | ▲ |
| 2026-06-15 | 148.14 | ▲ |
| 2026-06-12 | 149.7 | ▲ |
| 2026-06-11 | 149.19 | ▲ |
The calculated EMA20 and EMA50 indicate a dominant ▲ uptrend, reinforcing potential bullish momentum.
Support- and Resistance
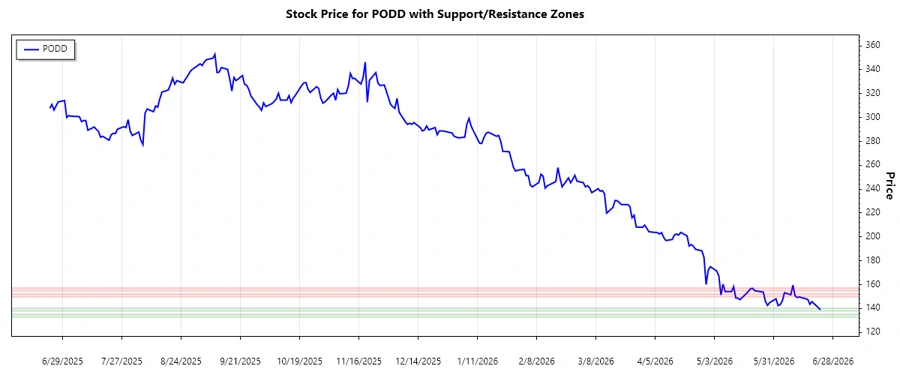
Through analysis of historical prices, the following support and resistance zones have been identified. Properly interpreting these areas can provide strategic entry and exit points for potential investors.
| Zone Type | From | To |
|---|---|---|
| Support Zone 1 | 138.00 | 140.00 |
| Support Zone 2 | 133.00 | 135.00 |
| Resistance Zone 1 | 150.00 | 152.00 |
| Resistance Zone 2 | 155.00 | 157.00 |
Currently, the stock is between the first resistance zone, highlighting a critical area for determining future movement.
A deeper understanding of these zones will aid in recognizing market patterns and potential reversals.
Conclusion
In summary, Insulet Corporation's stock has shown promising upward trends despite some recent fluctuations. The established support and resistance zones provide crucial insights for investment strategies. Nonetheless, caution is advised as market conditions remain dynamic, requiring continuous monitoring for potential market shifts.
Smart Data Insight
Master the Perfect Entry & Exit for this Stock
Don't leave your profits to chance. Historically, this stock follows specific seasonal patterns that institutional traders use to maximize returns.
- ✅ Identify the "Golden Buying Window"
- ✅ Avoid high-risk correction cycles
- ✅ Backtested data from the last 20+ years