October 23, 2025 a 05:15 am
PODD: Fibonacci Analysis - Insulet Corporation
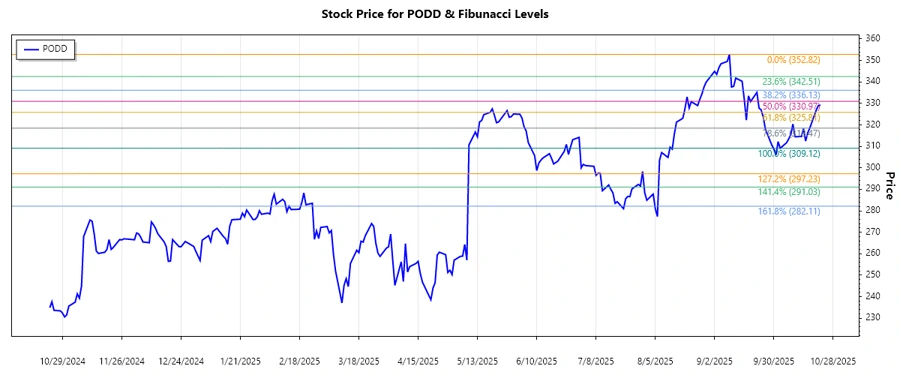
Insulet Corporation, trading under the ticker PODD, has shown dynamic movements in its stock price over recent months. The company, a key player in insulin delivery systems, faces market volatility influenced by healthcare innovations and market competitions. Recent price action has marked a strong downtrend, following a high in early September to lower levels seen in October.
Fibonacci Analysis
| Analysis Detail | Information |
|---|---|
| Trend Type | Downtrend |
| Start Date | 2025-09-09 |
| End Date | 2025-10-22 |
| High Point (Price and Date) | $352.82 on 2025-09-09 |
| Low Point (Price and Date) | $309.12 on 2025-10-03 |
| Fibonacci Level | Price Level |
|---|---|
| 0.236 | $341.66 |
| 0.382 | $334.57 |
| 0.5 | $330.97 |
| 0.618 | $327.38 |
| 0.786 | $321.55 |
The current price of $329.22 is within the 0.5 to 0.618 retracement range. This suggests potential support around these levels if the trend does not continue downwards. Fibonacci levels will be crucial in identifying resistance and support zones.
Conclusion
The technical analysis of Insulet Corporation's stock indicates significant downward correction potential, with Fibonacci levels suggesting key areas of support. However, given the innovative nature of its product and market base, there is always an opportunity for reversal if market sentiment shifts. Analysts should watch for confirmation signs at the respected retracement levels, observing whether these signify reversal or continuation. A break below the 0.618 level could imply continued weakness, while a bounce could indicate a potential rally. Risks involve market competition and regulatory challenges in healthcare, which could sway investor sentiment.
Smart Data Insight
Master the Perfect Entry & Exit for this Stock
Don't leave your profits to chance. Historically, this stock follows specific seasonal patterns that institutional traders use to maximize returns.
- ✅ Identify the "Golden Buying Window"
- ✅ Avoid high-risk correction cycles
- ✅ Backtested data from the last 20+ years