May 01, 2026 a 07:31 am

PNW: Dividend Analysis - Pinnacle West Capital Corporation
Pinnacle West Capital Corporation demonstrates a resilient dividend profile with a long-standing history of dividend payments. The company's recent financial data reflects a commitment to shareholder returns, but certain financial metrics warrant a cautious approach. An analysis of these figures provides a comprehensive understanding of its overall dividend health and sustainability.
📊 Overview
Pinnacle West Capital Corporation operates within the Utilities sector, offering a robust dividend yield alongside years of consistent payments. This stability is evidenced by a remarkable 38-year dividend history without a cut or suspension, underscoring the company's commitment to its shareholders.
| Metric | Value |
|---|---|
| Sector | Utilities |
| Dividend yield | 3.49% |
| Current dividend per share | 3.53 USD |
| Dividend history | 38 years |
| Last cut or suspension | None |
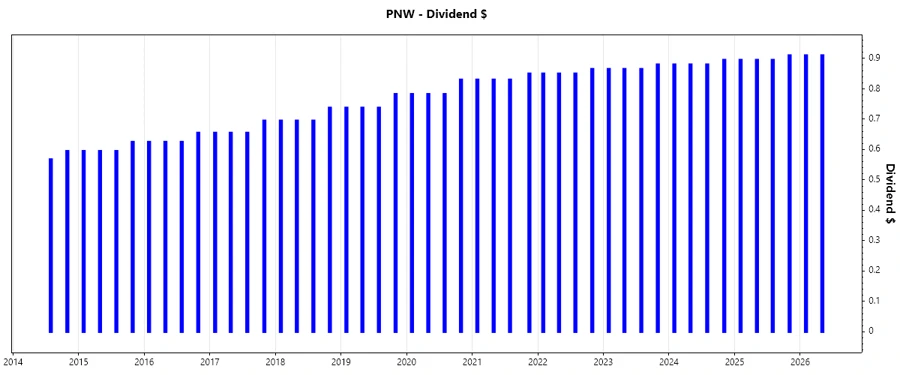
🗣️ Dividend History
The company's dividend history is a testament to its strong legacy of rewarding shareholders. Monitoring historical dividend payments can highlight the company's financial priorities and stability in returning capital to investors.
| Year | Dividend Per Share (USD) |
|---|---|
| 2026 | 1.82 |
| 2025 | 3.595 |
| 2024 | 3.535 |
| 2023 | 3.475 |
| 2022 | 3.415 |
📈 Dividend Growth
The growth analysis over the recent years provides insight into the company's effort to increase payouts. A steady growth pattern in dividends suggests underlying earnings resilience and management's confidence in the business's cash generation capability.
| Time | Growth |
|---|---|
| 3 years | 1.73% |
| 5 years | 2.50% |
The average dividend growth is 2.50% over 5 years. This shows moderate but steady dividend growth.
✅ Payout Ratio
The payout ratio is a critical metric indicating the proportion of earnings a company pays its shareholders in dividends. High EPS-based payout ratios may suggest aggressive dividend policies, while FCF-based ratios are indicative of the company's liquidity and ability to cover dividends from cash flow.
| Key Figure | Ratio |
|---|---|
| EPS-based | 68.58% |
| Free cash flow-based | -52.17% |
The EPS-based payout ratio of 68.58% is high, indicating a strong focus on shareholder returns. However, the negative FCF-based ratio suggests potential cash flow issues that could affect dividend sustainability in the longer term.
⚠️ Cashflow & Capital Efficiency
Understanding the relationship between cash flow, investments, and capital returns provides insights into operational efficiency. It is crucial for sustaining dividends and ensuring long-term growth.
| Metric | 2023 | 2024 | 2025 |
|---|---|---|---|
| Free Cash Flow Yield | -7.84% | -6.62% | -7.72% |
| Earnings Yield | 4.97% | 5.80% | 5.81% |
| CAPEX to Operating Cash Flow | 152.88% | 139.72% | 145.40% |
| Stock-based Compensation to Revenue | 0.37% | 0.46% | 0.00% |
| Free Cash Flow / Operating Cash Flow Ratio | -52.88% | -39.72% | -45.40% |
The negative cash flow yields reflect challenges in cash generation, potentially influencing future dividend commitments. The diverse use of capital appears efficiency-driven but may need realignment to bolster cash reserves.
📉 Balance Sheet & Leverage Analysis
Examining leverage and liquidity ratios is essential to assess the company's financial stability and risk. These ratios determine the ability to meet financial obligations and fund dividend distributions.
| Metric | 2023 | 2024 | 2025 |
|---|---|---|---|
| Debt-to-Equity | 2.53 | 1.64 | 2.53 |
| Debt-to-Assets | 56.33% | 42.33% | 56.33% |
| Debt-to-Capital | 71.69% | 62.06% | 71.69% |
| Net Debt to EBITDA | 8.38 | 5.33 | 8.38 |
| Current Ratio | 0.49 | 0.59 | 0.49 |
| Quick Ratio | 0.31 | 0.42 | 0.31 |
| Financial Leverage | 4.50 | 3.86 | 4.50 |
The elevated leverage ratios and modest current and quick ratios indicate a heavily leveraged position, raising concerns about capital structure and potential liquidity constraints.
🗣️ Fundamental Strength & Profitability
An evaluation of profitability ratios reveals the company's operational performance efficiency and its capacity for sustainable growth while supporting shareholder returns.
| Metric | 2023 | 2024 | 2025 |
|---|---|---|---|
| Return on Equity | 8.11% | 9.01% | 8.75% |
| Return on Assets | 2.03% | 2.33% | 1.95% |
| Net Margin | 10.68% | 11.88% | 11.55% |
| EBIT Margin | 19.74% | 21.74% | 21.73% |
| EBITDA Margin | 37.93% | 40.40% | 39.89% |
| Gross Margin | 39.28% | 41.70% | 25.41% |
| R&D to Revenue | 0.00% | 0.00% | 0.00% |
While profitability margins indicate competent cost management, the absence of significant R&D expenditures suggests limited emphasis on innovation, possibly affecting long-term value creation.
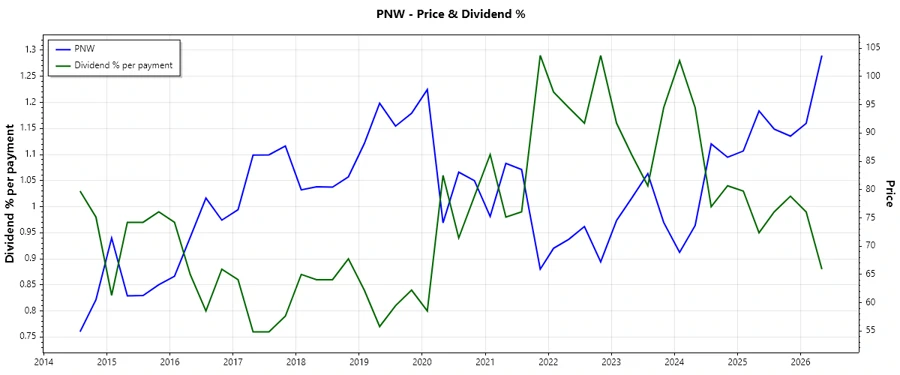
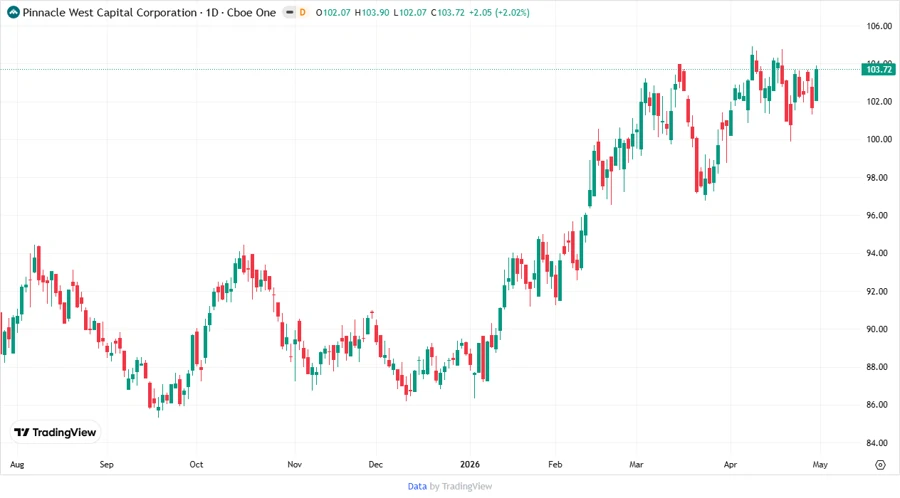
🗣️ Price Development
📊 Dividend Scoring System
| Category | Score | |
|---|---|---|
| Dividend yield | 4 | |
| Dividend Stability | 5 | |
| Dividend growth | 3 | |
| Payout ratio | 2 | |
| Financial stability | 2 | |
| Dividend continuity | 5 | |
| Cashflow Coverage | 2 | |
| Balance Sheet Quality | 2 |
Total Score: 25 out of 40
🗣️ Rating
Pinnacle West Capital Corporation's dividend profile highlights an attractive yield and exemplary dividend stability, although financial metrics reveal potential liquidity and cash flow challenges. This suggests a moderately cautious investment outlook, recommending a closer examination of future earnings capacity and cash flow improvement strategies for dividend sustainability.
Smart Data Insight
Master the Perfect Entry & Exit for this Stock
Don't leave your profits to chance. Historically, this stock follows specific seasonal patterns that institutional traders use to maximize returns.
- ✅ Identify the "Golden Buying Window"
- ✅ Avoid high-risk correction cycles
- ✅ Backtested data from the last 20+ years