February 04, 2026 a 02:47 am

PNW: Dividend Analysis - Pinnacle West Capital Corporation
Pinnacle West Capital Corporation presents a robust dividend profile with a notable history of maintaining consistent payouts over 38 years, reflecting its commitment to shareholder returns. However, the relatively modest dividend growth rate over the past years suggests a steady but cautious approach to dividend increases. Investors may find appeal in the company's reliable payout ratio and its sectoral positioning within utilities.
📊 Overview
The dividend profile of Pinnacle West highlights its established history in prudent payout management. With a compelling dividend yield of 3.94% and a current dividend per share at $3.47, it presents an attractive option for income-focused investors.
| Sector | Dividend Yield | Current Dividend Per Share | Dividend History | Last Cut or Suspension |
|---|---|---|---|---|
| Utilities | 3.94% | $3.47 | 38 years | None |
🗣️ Dividend History
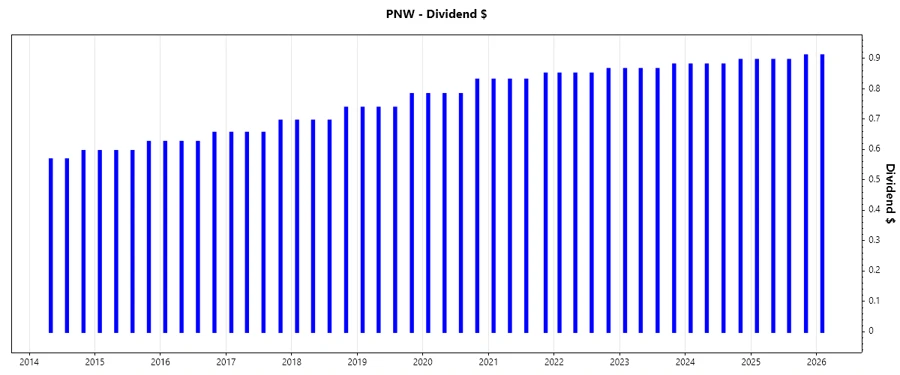
The consistent history of dividend payments is a hallmark of Pinnacle West's financial strategy, offering a reliable income stream for long-term investors. The company's ability to sustain payouts over decades demonstrates resilience and a strong underlying business model.
| Year | Dividend Per Share (USD) |
|---|---|
| 2026 | $0.91 |
| 2025 | $3.60 |
| 2024 | $3.54 |
| 2023 | $3.48 |
| 2022 | $3.42 |
📈 Dividend Growth
The reasonably low dividend growth rate of 1.73% over the last 3 years and 2.50% over the past 5 years suggests a conservative growth policy. Despite the modest increase, it indicates a consistent strategy toward sustaining dividend payouts.
| Time | Growth |
|---|---|
| 3 years | 1.73% |
| 5 years | 2.50% |
The average dividend growth is 2.50% over 5 years, indicating moderate but steady dividend growth.
⚠️ Payout Ratio
Payout ratios offer insight into the sustainability of dividend distributions. The EPS-based payout ratio of 69.78% reflects a stable dividend support level, while the negative free cash flow-based ratio flags potential short-term liquidity issues.
| Key Figure | Ratio |
|---|---|
| EPS-based | 69.78% |
| Free Cash Flow-based | -57.71% |
The 69.78% EPS payout ratio is within a reasonable range, implying that the company maintains its dividend obligations while the negative FCF payout ratio points to potential cash flow management challenges.
✅ Cashflow & Capital Efficiency
Analyzing cash flow and capital efficiency highlights the company's operational robustness and its investment returns. Pinnacle West's free cash flow yield is negative, indicating a potential strain on cash generation despite consistent operational performance.
| Metric | 2024 | 2023 | 2022 |
|---|---|---|---|
| Free Cash Flow Yield | -6.63% | -7.84% | -5.41% |
| Earnings Yield | 6.31% | 6.15% | 5.62% |
| CAPEX/Operating Cash Flow | 140.67% | 152.88% | 137.54% |
| Stock Compensation/Revenue | 0.12% | 0.37% | 0.37% |
| FCF/Operating Cash Flow | -39.72% | -52.88% | -37.54% |
The negative free cash flow yield underlines the company's ongoing investment cycle, though it benefits from a strong operational performance which supports sustainable cash flow coverage.
📉 Balance Sheet & Leverage Analysis
Evaluating the balance sheet fundamentals reveals the extent of financial leverage and liquidity positioning critical to understanding the financial risk profile.
| Metric | 2024 | 2023 | 2022 |
|---|---|---|---|
| Debt-to-Equity | 163.57% | 166.78% | 146.76% |
| Debt-to-Assets | 42.33% | 41.78% | 39.07% |
| Debt-to-Capital | 62.06% | 62.52% | 59.48% |
| Net Debt to EBITDA | 6.78x | 5.78x | 5.38x |
| Current Ratio | 0.67 | 0.67 | 0.99 |
| Quick Ratio | 0.42 | 0.50 | 0.74 |
| Financial Leverage | 3.86 | 3.99 | 3.76 |
The leverage ratios are relatively high, highlighting a substantial debt position which could constrain financial flexibility in adverse conditions. However, the established asset base provides a buffer against liquidity concerns.
⚖️ Fundamental Strength & Profitability
Fundamental metrics assessment provides insights into profitability and operational efficiency which are pivotal for long-term investor confidence.
| Metric | 2024 | 2023 | 2022 |
|---|---|---|---|
| Return on Equity | 9.01% | 8.12% | 7.99% |
| Return on Assets | 2.33% | 2.03% | 2.13% |
| Return on Invested Capital | 3.48% | 3.08% | 2.97% |
| Net Margin | 11.88% | 10.68% | 11.18% |
| EBIT Margin | 21.74% | 19.74% | 19.22% |
| EBITDA Margin | 40.40% | 37.93% | 38.13% |
| Gross Margin | 41.70% | 39.28% | 39.50% |
The profitability ratios indicate a healthy financial position with strong returns on equity and assets. This firm foundation supports the company's ability to continue rewarding investors through dividends.
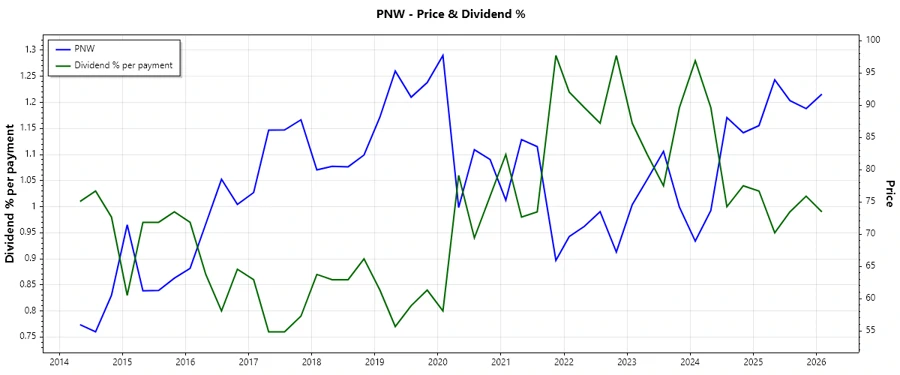
Price Development
⭐ Dividend Scoring System
| Category | Score | Description |
|---|---|---|
| Dividend Yield | 4/5 | |
| Dividend Stability | 5/5 | |
| Dividend Growth | 3/5 | |
| Payout Ratio | 3/5 | |
| Financial Stability | 3/5 | |
| Dividend Continuity | 5/5 | |
| Cashflow Coverage | 2/5 | |
| Balance Sheet Quality | 3/5 |
Total Score: 28/40
🔍 Rating
Overall, Pinnacle West Capital Corporation stands out as a solid choice for dividend-seeking investors, with consistent dividend payments and a commitment to shareholder value. Its score reflects a robust dividend stability but highlights areas to watch, like cash flow coverage and leverage. Investors should consider this balanced profile in line with their risk tolerance and income requirements.