December 27, 2025 a 02:46 am


PNW: Dividend Analysis - Pinnacle West Capital Corporation
Pinnacle West Capital Corporation is a robust dividend-paying company within the utility sector. Despite recent challenges, indicated by a dividend cut in 2026, the company's long-term dividend history is commendable with 38 years of payments, reflecting its commitment to returning value to shareholders. However, increased payout ratios and negative free cash flow yield highlight potential fiscal vulnerabilities that investors should be wary of.
📊 Overview
The following metrics provide a snapshot of Pinnacle West Capital Corporation's current dividend profile:
| Aspect | Details |
|---|---|
| Sector | Utilities |
| Dividend yield | 4.08 % |
| Current dividend per share | 3.47 USD |
| Dividend history | 38 years |
| Last cut or suspension | 2026 |
📈 Dividend History
Pinnacle's dividend history offers insights into its dividend stability and reliability across different economic cycles. The stability of payouts over decades illustrates a strong commitment to shareholder returns, though recent cuts in 2026 signal caution.
Recent Dividends
| Year | Dividend per Share (USD) |
|---|---|
| 2026 | 0.91 |
| 2025 | 3.595 |
| 2024 | 3.535 |
| 2023 | 3.475 |
| 2022 | 3.415 |
📉 Dividend Growth
The company's capacity to boost its dividends over time is a key indicator of financial health and profitability. Pinnacle's dividend growth has been modest but consistent over the last years.
| Time | Growth |
|---|---|
| 3 years | 1.91 % |
| 5 years | 3.37 % |
The average dividend growth is 3.37 % over 5 years. This shows moderate but steady dividend growth.
💼 Payout Ratio
Payout ratios provide insights into the sustainability of dividend payments. High ratios can limit dividend growth prospects, while low ratios might indicate a capacity for future increases.
| Key figure | Ratio |
|---|---|
| EPS-based | 69.78 % |
| Free cash flow-based | -57.71 % |
The 69.78 % EPS payout ratio suggests a reasonable distribution to shareholders. However, a negative 57.71 % free cash flow payout ratio indicates potential liquidity stress that might affect future dividend sustainability.
🔍 Cashflow & Capital Efficiency
Reviewing cash flow metrics gives substantial insights into the company's financial flexibility and efficiency in utilizing capital.
| Metric | 2024 | 2023 | 2022 |
|---|---|---|---|
| Free Cash Flow Yield | -6.63 % | -7.84 % | -5.41 % |
| Earnings Yield | 6.31 % | 6.15 % | 5.62 % |
| CAPEX to Operating Cash Flow | 140.67 % | 152.88 % | 137.54 % |
| Stock-based Compensation to Revenue | 0.12 % | 0.37 % | 0.37 % |
| Free Cash Flow / Operating Cash Flow Ratio | -39.72 % | -52.88 % | -37.54 % |
Despite a negative free cash flow yield, efficiency ratios like earnings yield remain positive, bolstering optimism for potential capital returns and operational reinvestment opportunities.
🗣️ Balance Sheet & Leverage Analysis
Analysing leverage ratios can indicate financial health, liquidity, and the ability to meet obligations as they come due.
| Metric | 2024 | 2023 | 2022 |
|---|---|---|---|
| Debt-to-Equity | 163.57 % | 166.78 % | 146.76 % |
| Debt-to-Assets | 42.33 % | 41.78 % | 39.07 % |
| Debt-to-Capital | 62.06 % | 62.52 % | 59.48 % |
| Net Debt to EBITDA | 5.33 | 5.78 | 5.38 |
| Current Ratio | 0.60 | 0.67 | 0.99 |
| Quick Ratio | 0.42 | 0.50 | 0.74 |
| Financial Leverage | 3.86 | 3.99 | 3.76 |
While leverage ratios indicate a relatively high level of indebtedness, the improvement in the quick and current ratios promises enhanced liquidity. Nevertheless, caution is warranted.
🔍 Fundamental Strength & Profitability
Profitability ratios give an understanding of how efficiently the company manages to produce profit and returns on investments compared to its peers.
| Metric | 2024 | 2023 | 2022 |
|---|---|---|---|
| Return on Equity | 9.01 % | 8.12 % | 8.00 % |
| Return on Assets | 2.33 % | 2.03 % | 2.13 % |
| Return on Invested Capital | 3.48 % | 3.08 % | 2.97 % |
| Margins: Net | 11.88 % | 10.68 % | 11.18 % |
| EBIT | 21.74 % | 19.74 % | 19.22 % |
| EBITDA | 40.39 % | 37.93 % | 38.13 % |
| Gross | 41.70 % | 39.28 % | 39.50 % |
| Research & Development to Revenue | 0 % | 0 % | 0 % |
With consistent margins and a positive return on equity, Pinnacle West benefits from profitability even amid challenging market conditions. However, innovation investments appear to be lacking.
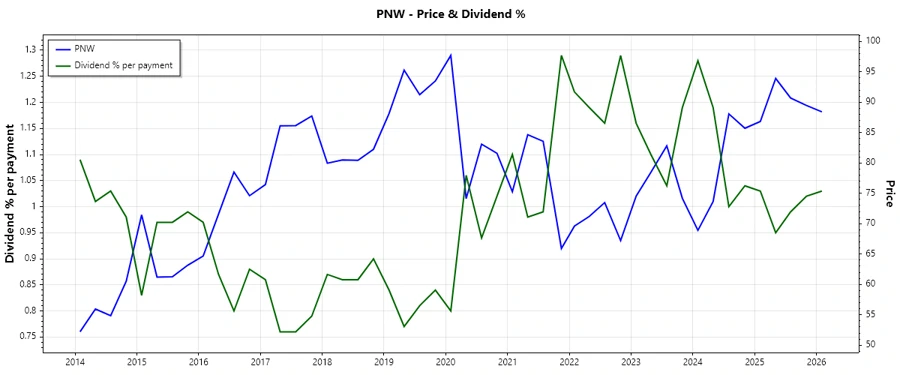
📈 Price Development
✅ Dividend Scoring System
| Criteria | Score (out of 5) | Details |
|---|---|---|
| Dividend yield | 4 | |
| Dividend Stability | 3 | |
| Dividend growth | 3 | |
| Payout ratio | 2 | |
| Financial stability | 3 | |
| Dividend continuity | 4 | |
| Cashflow Coverage | 2 | |
| Balance Sheet Quality | 3 |
Total Score: 24/40
🗣️ Rating
While Pinnacle West Capital Corporation exhibits a reliable dividend history, its recent fiscal challenges signal caution. The current dividend yield remains attractive, yet investors should be mindful of the company's ability to maintain these payouts given its rising financial leverage and constrained cash flow. Overall, Pinnacle West remains a moderate dividend investment option, rated as "Hold" with an outlook to monitor for any substantial balance sheet improvements or strategic pivots to enhance cash flow stability.