December 24, 2025 a 07:31 am

PNW: Dividend Analysis - Pinnacle West Capital Corporation
Pinnacle West Capital Corporation exhibits a solid track record of consistent dividend payments, offering a dividend yield that outpaces many of its peers. Despite a challenging macroeconomic environment, the company's ability to maintain and grow dividends over the past 38 years underscores its commitment to shareholder value. However, the recent dividend cut in 2026 may raise concerns about future payout sustainability.
📊 Overview
Pinnacle West Capital Corporation operates within the Utilities sector, renowned for its resilience and consistent cash flow. The company's dividend yield of 4.13% offers attractive income potential for investors, supplemented by its current dividend per share of $3.47. With a commendable 38-year dividend history, Pinnacle West demonstrates a strong commitment to returning value to shareholders. However, the recent dividend action in 2026 may require scrutiny.
| Attribute | Details |
|---|---|
| Sector | Utilities |
| Dividend Yield | 4.13 % |
| Current Dividend per Share | 3.47 USD |
| Dividend History | 38 years |
| Last Cut or Suspension | 2026 |
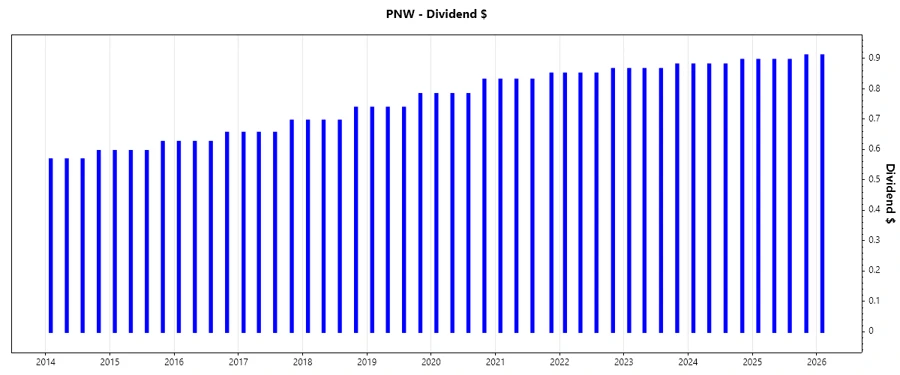
🗣️ Dividend History
The dividend history of Pinnacle West is essential in evaluating its commitment to annual shareholder returns. Over the last five years, the dividends have consistently grown, providing investors with a reliable income stream.
| Year | Dividend per Share |
|---|---|
| 2026 | 0.91 USD |
| 2025 | 3.595 USD |
| 2024 | 3.535 USD |
| 2023 | 3.475 USD |
| 2022 | 3.415 USD |
📈 Dividend Growth
Evaluating dividend growth is critical as it reflects the company's future dividend prospects and financial health. A slow yet stable growth is evident, indicating potential for sustainable long-term returns.
| Time | Growth |
|---|---|
| 3 years | 1.91 % |
| 5 years | 3.37 % |
The average dividend growth is 3.37% over 5 years. This shows moderate but steady dividend growth.
📉 Payout Ratio
The payout ratio is a crucial metric for assessing dividend sustainability, offering insights into how much of the company’s earnings are paid out as dividends. The EPS-based payout ratio of 69.78% suggests a high degree of profit allocation to dividends, whereas the negative FCF-based payout ratio indicates underlying financial stress that needs attention.
| Key Figure | Ratio |
|---|---|
| EPS-based | 69.78 % |
| Free cash flow-based | -57.71 % |
The EPS payout ratio indicates a reasonable use of earnings for dividends, but the negative FCF payout ratio is concerning, pointing to possible cash flow challenges.
✅ Cashflow & Capital Efficiency
Cash flow and capital efficiency highlight the company's ability to generate free cash flow relative to its revenue and deployment of capital in operations. Pinnacle West's negative Free Cash Flow Yield and CAPEX to Operating Cash Flow ratios suggest potential inefficiencies or cyclical investment freedom.
| Metrics | 2024 | 2023 | 2022 |
|---|---|---|---|
| Free Cash Flow Yield | -6.63 % | -7.84 % | -5.41 % |
| Earnings Yield | 6.31 % | 6.15 % | 5.62 % |
| CAPEX to Operating Cash Flow | 140.67 % | 152.88 % | 137.54 % |
| Stock-based Compensation to Revenue | 0.12 % | 0.37 % | 0.37 % |
| Free Cash Flow / Operating Cash Flow Ratio | -39.72 % | -52.88 % | -37.54 % |
The metrics suggest that Pinnacle West has room for improvement in terms of capital deployment and cash management, which are critical for enhancing shareholder value through robust free cash flow.
🔍 Balance Sheet & Leverage Analysis
Examining the balance sheet and leverage ratios provides insights into the company's financial stability and debt management. Pinnacle West's high debt ratios and moderate coverage ratios indicate significant leverage that could impact financial flexibility.
| Metrics | 2024 | 2023 | 2022 |
|---|---|---|---|
| Debt-to-Equity | 1.636 | 1.668 | 1.468 |
| Debt-to-Assets | 42.33 % | 41.78 % | 39.07 % |
| Debt-to-Capital | 62.06 % | 62.52 % | 59.48 % |
| Net Debt to EBITDA | 5.33 | 5.78 | 5.38 |
| Current Ratio | 0.61 | 0.67 | 0.99 |
| Quick Ratio | 0.42 | 0.50 | 0.74 |
| Financial Leverage | 3.86 | 3.99 | 3.76 |
The financial stability indicates the necessity for Pinnacle West to manage its leverage actively to improve its financial structure and increase liquidity buffers.
💪 Fundamental Strength & Profitability
Profitability metrics reveal how efficiently a company generates income, while fundamental analysis indicates its long-term financial health. Pinnacle West's steady return metrics and profit margins highlight its sustainable business model amidst fluctuating economic environments.
| Metrics | 2024 | 2023 | 2022 |
|---|---|---|---|
| Return on Equity | 9.01 % | 8.12 % | 8.00 % |
| Return on Assets | 2.33 % | 2.03 % | 2.13 % |
| Margins: Net | 11.88 % | 10.68 % | 11.18 % |
| Margins: EBIT | 21.74 % | 19.74 % | 19.22 % |
| Margins: EBITDA | 40.40 % | 37.93 % | 38.13 % |
| Margins: Gross | 41.70 % | 39.28 % | 39.50 % |
| Research & Development to Revenue | 0 % | 0 % | 0 % |
Overall, Pinnacle West's profitability remains robust, marked by stable return metrics, although potential investments in innovation and technology may have been overlooked.
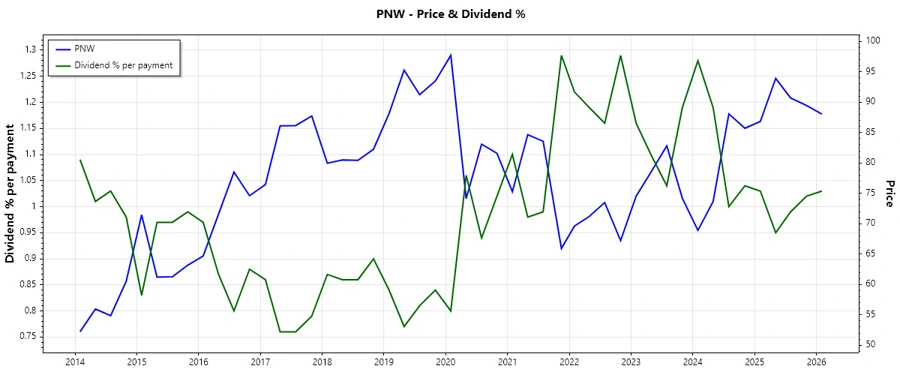
📉 Price Development
✅ Dividend Scoring System
| Criteria | Score | Comments |
|---|---|---|
| Dividend Yield | 4 | |
| Dividend Stability | 3 | |
| Dividend Growth | 3 | |
| Payout Ratio | 3 | |
| Financial Stability | 3 | |
| Dividend Continuity | 2 | |
| Cashflow Coverage | 2 | |
| Balance Sheet Quality | 3 |
Total Score: 23/40
⭐ Rating
Pinnacle West Capital Corporation presents itself as a stable dividend player with a well-established history of payments. However, the recent dividend cut raises concerns about future consistency. With a total score of 23 out of 40, Pinnacle West is a moderate dividend play. Investors seeking reliable income may prefer to keep a cautious eye on the company's cash flow and financial health moving forward.