
July 27, 2026 a 03:31 am

PNR: Dividend Analysis - Pentair plc
Pentair plc demonstrates a robust dividend profile, characterized by consistent growth and a sustainable payout ratio. The company's sturdy financials and strategic dividend policy underline its commitment to returning value to shareholders. With advanced capital efficiency and steady growth, Pentair plc showcases financial resilience and dividend reliability.
📊 Overview
Pentair plc operates within the capital goods sector, demonstrating strong dividend attributes with a yield of 1.69%. The company maintains a historical dividend per share of approximately 1.00 USD, unmarred by recent cuts, a testament to its enduring 38-year dividend history and financial stability.
| Detail | Value |
|---|---|
| Sector | Capital Goods |
| Dividend yield | 1.69 % |
| Current dividend per share | 1.00 USD |
| Dividend history | 38 years |
| Last cut or suspension | None |
🗣️ Dividend History
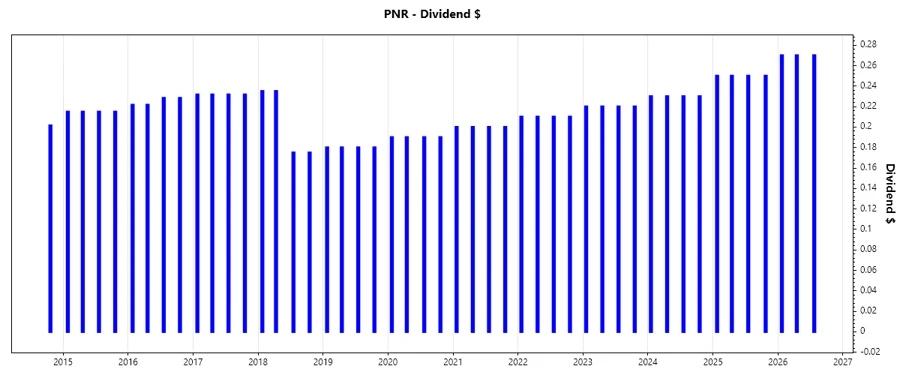
Tracing the history of dividends reveals Pentair's consistent commitment to shareholder returns. The company's steadfast dividend trajectory over the years signifies financial health and reliability, appealing traits for long-term investors.
| Year | Dividend per Share (USD) |
|---|---|
| 2026 | 0.81 |
| 2025 | 1.00 |
| 2024 | 0.92 |
| 2023 | 0.88 |
| 2022 | 0.84 |
📈 Dividend Growth
An examination of dividend growth rates reveals Pentair's reliable increment in shareholder returns. Over the past 3 and 5 years, growth rates held steady at approximately 5.98% and 5.64%, respectively. This consistent growth trajectory underscores a moderate but dependable expansion, indicating stable income opportunities for investors.
| Time | Growth |
|---|---|
| 3 years | 5.98 % |
| 5 years | 5.64 % |
The average dividend growth is 5.64% over 5 years. This shows moderate but steady dividend growth, reinforcing Pentair's capability to enhance shareholder value over time.
📉 Payout Ratio
Payout ratios are critical in evaluating dividend sustainability. Pentair's payout ratio sits at 24.24% (EPS-based) and 22.60% (FCF-based), indicating a comfortably sustainable range. A low payout ratio suggests that the company retains ample capital for reinvestment while still providing reliable dividends.
| Key figure | Ratio |
|---|---|
| EPS-based | 24.24 % |
| Free cash flow-based | 22.60 % |
The company's low payout ratios across EPS and FCF indicate a sustainable dividend approach, secured by extensive earnings coverage and strategic liquidity management.
🟢 Cashflow & Capital Efficiency
Analyzing free cash flow and capital returns highlights Pentair's operational efficiency. Sustaining a free cash flow yield of 7.04% coupled with a robust earnings yield signifies efficient capital deployment and strong operational cash reserves. Such metrics are indicative of sound investment decisions and robust financial planning.
| Year | 2023 | 2024 | 2025 |
|---|---|---|---|
| Free Cash Flow Yield | 7.04% | 4.12% | 4.37% |
| Earnings Yield | 6.57% | 3.72% | 3.83% |
| CAPEX to Operating Cash Flow | 12.27% | 9.70% | 8.44% |
| Stock-based Compensation to Revenue | 0.71% | 0.97% | 0.89% |
| Free Cash Flow / Operating Cash Flow Ratio | 87.73% | 90.30% | 91.56% |
This efficiency reflects Pentair's ability to manage capital investments prudently, delivering consistent financial health and value growth for shareholders.
⚖️ Balance Sheet & Leverage Analysis
Evaluating the balance sheet metrics such as debt ratios and leverage reveals Pentair's financial stability. Pentair's leverage ratios imply a conservative debt management approach, critical for sustaining long-term growth amidst varying market conditions.
| Year | 2023 | 2024 | 2025 |
|---|---|---|---|
| Debt-to-Equity | 0.65 | 0.50 | 0.42 |
| Debt-to-Assets | 0.32 | 0.27 | 0.24 |
| Debt-to-Capital | 0.39 | 0.33 | 0.30 |
| Net Debt to EBITDA | 2.26 | 1.79 | 1.63 |
| Current Ratio | 1.65 | 1.60 | 1.61 |
| Quick Ratio | 0.94 | 0.92 | 0.95 |
| Financial Leverage | 2.04 | 1.81 | 1.78 |
Strong liquidity and manageable leverage maintain Pentair's capacity to meet short-term liabilities while ensuring capital adequacy for future investments.
🏦 Fundamental Strength & Profitability
Pentair's fundamental metrics illustrate a robust financial position supported by strong profitability ratios. High returns on equity and assets, alongside prevalent profit margins, validate the firm's operational efficiency and profitability.
| Year | 2023 | 2024 | 2025 |
|---|---|---|---|
| Return on Equity | 19.36% | 17.55% | 16.90% |
| Return on Assets | 9.49% | 9.70% | 9.52% |
| Net Margin | 15.17% | 15.32% | 15.66% |
| EBIT Margin | 17.96% | 19.78% | 19.78% |
| EBITDA Margin | 20.76% | 22.58% | 22.60% |
| Gross Margin | 37.01% | 39.16% | 40.48% |
| Research & Development to Revenue | 2.43% | 2.29% | 2.30% |
With a focus on innovation and operational excellence, Pentair continues to deliver superior financial performance, amplifying its competitive edge and shareholder returns.
📉 Price Development
✅ Dividend Scoring System
| Category | Score | Rating |
|---|---|---|
| Dividend yield | 3 | |
| Dividend Stability | 5 | |
| Dividend growth | 4 | |
| Payout ratio | 5 | |
| Financial stability | 4 | |
| Dividend continuity | 5 | |
| Cashflow Coverage | 4 | |
| Balance Sheet Quality | 4 |
Total Score: 34/40
🗳️ Rating
With a strong dividend history, impressive financial health, and consistent growth, Pentair plc proves to be a reliable choice for dividend-focused investors. Its strategic approach to capital management and shareholder returns promises stability and growth, recommending it as a solid addition for any dividend portfolio.
Smart Data Insight
Master the Perfect Entry & Exit for this Stock
Don't leave your profits to chance. Historically, this stock follows specific seasonal patterns that institutional traders use to maximize returns.
- ✅ Identify the "Golden Buying Window"
- ✅ Avoid high-risk correction cycles
- ✅ Backtested data from the last 20+ years