March 15, 2026 a 07:46 am

PNR: Dividend Analysis - Pentair plc
Pentair plc, a diversified industrial company, presents itself as a potentially viable investment for dividend-focused portfolios. With a dividend yield of 1.18% and a robust history of consistent payments over 38 years, the company demonstrates a strong commitment to rewarding its shareholders. Further analysis into its payout ratios and financial stability indicates a sustainable dividend policy, backed by solid earnings and free cash flow metrics.
📊 Overview
Pentair plc operates within a sector that benefits from steady income streams, making it an attractive choice for dividend-seeking investors. The company's dividend yield stands at 1.18%, which, when considered alongside its current dividend per share of $1.00 and a 38-year history of uninterrupted payments, signals its stability. With no recent cuts or suspensions, it reflects resilience even through economic volatility.
| Metric | Details |
|---|---|
| Sector | Industrial |
| Dividend Yield | 1.18% |
| Current Dividend Per Share | 1.00 USD |
| Dividend History | 38 years |
| Last Cut or Suspension | None |
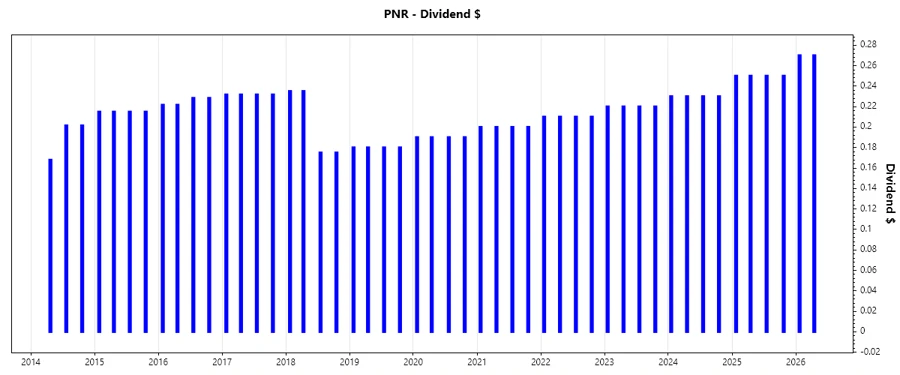
🗣️ Dividend History
The dividend history of Pentair plc is a testament to its financial health and management's commitment to shareholder returns. A long history of regular dividend payments boosts investor confidence and indicates potential for consistent income.
| Year | Dividend Per Share (USD) |
|---|---|
| 2026 | 0.54 |
| 2025 | 1.00 |
| 2024 | 0.92 |
| 2023 | 0.88 |
| 2022 | 0.84 |
📈 Dividend Growth
Monitoring dividend growth is vital for potential long-term investors, as it indicates the ability of the company to enhance shareholder value year over year. Pentair's average growth figures illustrate a balanced yet progressive approach.
| Time | Growth |
|---|---|
| 3 years | 5.98% |
| 5 years | 5.64% |
The average dividend growth is 5.64% over 5 years. This shows moderate but steady dividend growth, pointing to prudent fiscal management and potentially enhanced shareholder value.
✅ Payout Ratio
The payout ratio is a critical metric that helps determine dividend sustainability. Pentair’s relatively low payout ratios suggest ample room to maintain or potentially increase dividend payments without straining financial resources.
| Key figure ratio | Percentage |
|---|---|
| EPS-based | 25.02% |
| Free cash flow-based | 21.96% |
Pentair's payout ratios of 25.02% (EPS) and 21.96% (FCF) indicate a healthy balance, ensuring dividend sustainability without compromising growth or financial health.
⚠️ Cashflow & Capital Efficiency
A thorough understanding of cash flow and capital efficiency is indispensable for evaluating a company's ability to support dividends and fund operations.
| Year | 2023 | 2024 | 2025 |
|---|---|---|---|
| Free Cash Flow Yield | 5.16% | 4.12% | 4.37% |
| Earnings Yield | 4.53% | 3.72% | 3.83% |
| CAPEX to Operating Cash Flow | 8.44% | 9.70% | 8.44% |
| Stock-based Comp to Revenue | 0.89% | 0.97% | 0.89% |
| FCF/Operating Cash Flow Ratio | 91.56% | 90.30% | 91.56% |
Stable cash flow metrics and efficient capital allocation signify Pentair's ability to sustain operation and dividend commitments, reflecting positively on its long-term investment potential.
📉 Balance Sheet & Leverage Analysis
Sound leverage ratios are essential for maintaining financial stability. Pentair's key figures highlight careful debt management, contributing to its risk assessment.
| Year | 2023 | 2024 | 2025 |
|---|---|---|---|
| Debt-to-Equity | 0.65 | 0.50 | 0.42 |
| Debt-to-Assets | 31.90% | 27.41% | 23.86% |
| Debt-to-Capital | 39.42% | 33.15% | 29.75% |
| Net Debt to EBITDA | 2.26 | 1.79 | 1.63 |
| Current Ratio | 1.65 | 1.60 | 1.61 |
| Quick Ratio | 0.94 | 0.92 | 0.95 |
| Financial Leverage | 2.04 | 1.81 | 1.78 |
Pentair’s stable leverage ratios and liquidity positions reinforce its financial robustness, helping it manage obligations efficiently and maintain operational flexibility.
🔍 Fundamental Strength & Profitability
Fundamental metrics are key indicators of a company’s financial health and operational efficiency, often directly impacting dividends.
| Year | 2023 | 2024 | 2025 |
|---|---|---|---|
| Return on Equity | 19.36% | 17.55% | 16.90% |
| Return on Assets | 9.49% | 9.70% | 9.52% |
| Margins: Net | 15.17% | 15.32% | 15.66% |
| EBIT Margin | 17.96% | 19.78% | 19.78% |
| EBITDA Margin | 20.76% | 22.58% | 22.60% |
| Gross Margin | 37.01% | 39.16% | 40.48% |
| R&D to Revenue | 2.43% | 2.29% | 2.30% |
Pentair plc displays strong profitability and return metrics, a positive signal for steady dividend growth and equity building over time.
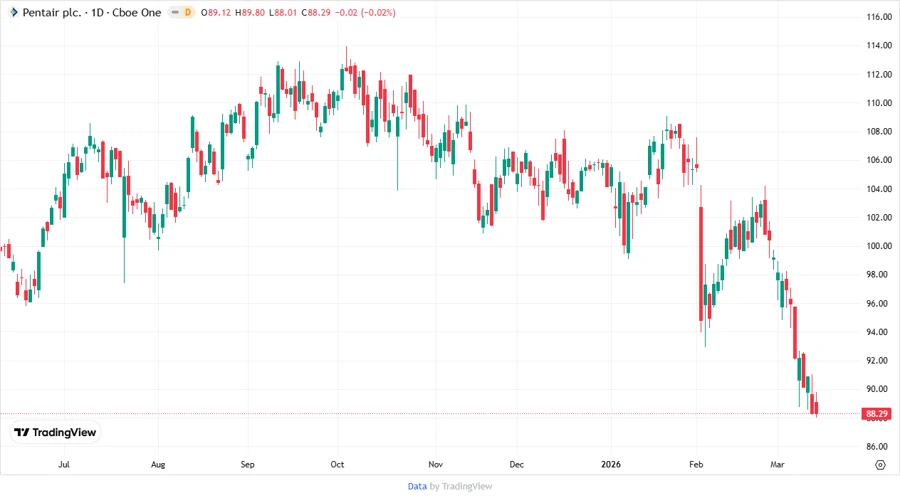
💹 Price Development
⭐ Dividend Scoring System
| Criterion | Score | Visual Representation |
|---|---|---|
| Dividend Yield | 3/5 | |
| Dividend Stability | 5/5 | |
| Dividend Growth | 4/5 | |
| Payout Ratio | 5/5 | |
| Financial Stability | 5/5 | |
| Dividend Continuity | 5/5 | |
| Cashflow Coverage | 4/5 | |
| Balance Sheet Quality | 5/5 |
Overall Score: 36/40
🔮 Rating
Pentair plc is recommended as a stable investment option for income-focused portfolios due to its strong dividend history, manageable payout ratios, and solid financial foundation. While the current dividend yield might not be at the high end of the spectrum, the company’s consistent growth and efficiency metrics suggest it is well-positioned for continued shareholder returns.
Smart Data Insight
Master the Perfect Entry & Exit for this Stock
Don't leave your profits to chance. Historically, this stock follows specific seasonal patterns that institutional traders use to maximize returns.
- ✅ Identify the "Golden Buying Window"
- ✅ Avoid high-risk correction cycles
- ✅ Backtested data from the last 20+ years