
July 10, 2026 a 06:00 pm
PNC: Fundamental Ratio Analysis - The PNC Financial Services Group, Inc.
The PNC Financial Services Group, Inc. demonstrates a stable performance within the regional banking sector in the US, offering a broad range of financial solutions. Its recent strategic expansions and technology innovations highlight its adaptability. However, market volatility and regulatory challenges may pose risks in the upcoming quarters.
Fundamental Rating
The fundamental ratings of PNC suggest a stable outlook with room for growth, particularly in discounted cash flow and return on equity metrics.
| Category | Score | Visual |
|---|---|---|
| Discounted Cash Flow | 4 | |
| Return on Equity | 4 | |
| Return on Assets | 3 | |
| Debt to Equity | 2 | |
| Price to Earnings | 3 | |
| Price to Book | 2 |
Historical Rating
Current and past scores indicate consistent performance with slight fluctuations across fundamental metrics.
| Date | Overall | DCF | ROE | ROA | D/E | P/E | P/B |
|---|---|---|---|---|---|---|---|
| 2026-07-10 | 3 | 4 | 4 | 3 | 2 | 3 | 2 |
| - | 0 | 4 | 4 | 3 | 2 | 3 | 2 |
Analyst Price Targets
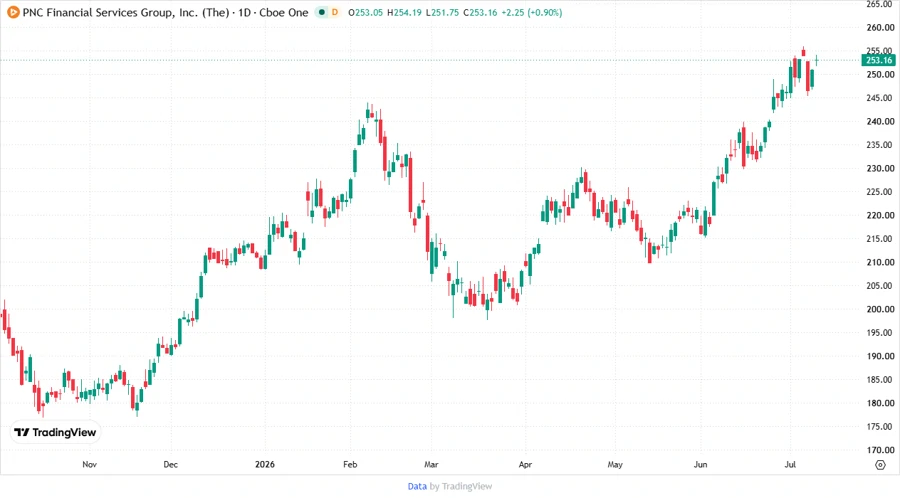
Analyst estimates show varying price targets, signaling a consensus around $269.5, suggesting moderate potential for appreciation.
| High | Low | Median | Consensus |
|---|---|---|---|
| $288 | $235 | $274 | $269.5 |
Analyst Sentiment
The sentiment leans towards a stable outlook with a predominant 'Hold' recommendation.
| Recommendation | Count | Visual |
|---|---|---|
| Strong Buy | 0 | |
| Buy | 22 | |
| Hold | 23 | |
| Sell | 1 | |
| Strong Sell | 0 |
Conclusion
PNC Financial Services Group, Inc. presents a promising investment opportunity with a robust range of financial offerings and solid fundamental scores, especially in terms of discounted cash flow and return on equity. Analyst sentiment suggests holding, reflecting a consistent historical performance despite economic uncertainties. The varied price targets underscore potential growth, although they also highlight inherent market risks. Careful monitoring of market conditions and regulatory changes is advised to capitalize on future stock performance.
Smart Data Insight
Master the Perfect Entry & Exit for this Stock
Don't leave your profits to chance. Historically, this stock follows specific seasonal patterns that institutional traders use to maximize returns.
- ✅ Identify the "Golden Buying Window"
- ✅ Avoid high-risk correction cycles
- ✅ Backtested data from the last 20+ years