April 29, 2026 a 04:44 pm

PNC: Fibonacci Analysis - The PNC Financial Services Group, Inc.
The PNC Financial Services Group, Inc. has shown remarkable resilience in the financial sector. With a strong presence in retail, corporate, and asset management banking, PNC is poised for strategic growth. The recent trend analysis indicates a potential for further developments and insights can be gleaned from a Fibonacci analysis.
Fibonacci Analysis
The analysis of historical data identifies a recent downtrend from February to April 2026. This period is distinguished by a gradual decrease in stock prices. Let's examine the key figures:
| Factor | Details |
|---|---|
| Trend Start Date | 2026-02-06 |
| Trend End Date | 2026-04-29 |
| High Point | $242.48 on 2026-02-06 |
| Low Point | $209.24 on 2026-04-01 |
Using these figures, the following Fibonacci Retracement Levels have been calculated:
| Fibonacci Level | Price |
|---|---|
| 0.236 | $235.40 |
| 0.382 | $229.20 |
| 0.5 | $225.86 |
| 0.618 | $222.52 |
| 0.786 | $217.72 |
The current price is $218.57 as of 2026-04-29, indicating that it is in the 0.786 retracement zone.
This positioning suggests a potential support level. Traders may find this area as a strategic point for entry, anticipating a bounce back or further decline based on market conditions.
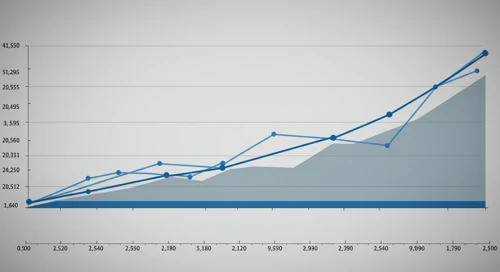
Stock chart displaying Fibonacci retracement levels and trends.
Conclusion
In conclusion, PNC's recent downtrend reflects the broader market's volatility and presents both opportunities and risks. The stock price residing in the 0.786 Fibonacci retracement level suggests an important support level that could attract buyers. Analysts should consider the influence of macroeconomic variables and company-specific developments. As PNC continues its strategic expansions and adaptations, it remains a compelling subject for further observation and technical analysis.