May 16, 2026 a 03:31 pm

PNC: Dividend Analysis - The PNC Financial Services Group, Inc.
The PNC Financial Services Group, Inc. presents a robust dividend profile that is enticing for dividend investors. With a long-standing dividend history and consistent growth, it draws attention for its reliability. The modest dividend yield with a stable payout ratio underscores prudent fiscal management which balances growth with shareholder returns. However, any potential investor should also weigh in the broader financial metrics and market conditions affecting the banking sector today.
📊 Overview
Analyzing The PNC Financial Services Group, Inc.'s dividend metrics provides valuable insight into its market appeal and reliability.
| Metric | Value |
|---|---|
| Sector | Financial Services |
| Dividend yield | 3.07 % |
| Current dividend per share | 7.47 USD |
| Dividend history | 42 years |
| Last cut or suspension | None |
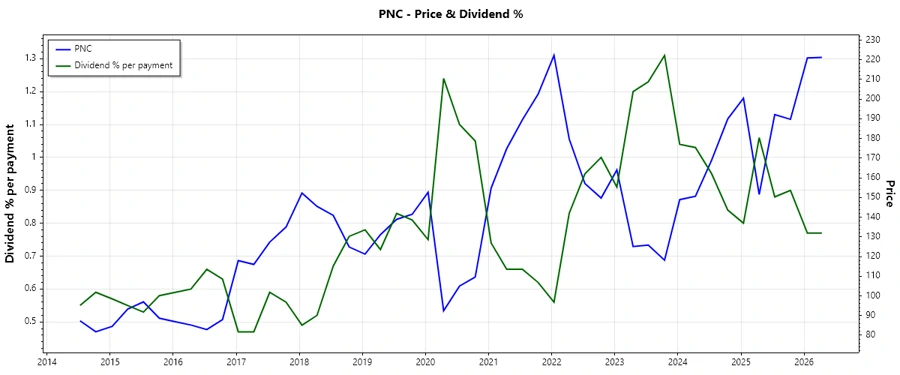
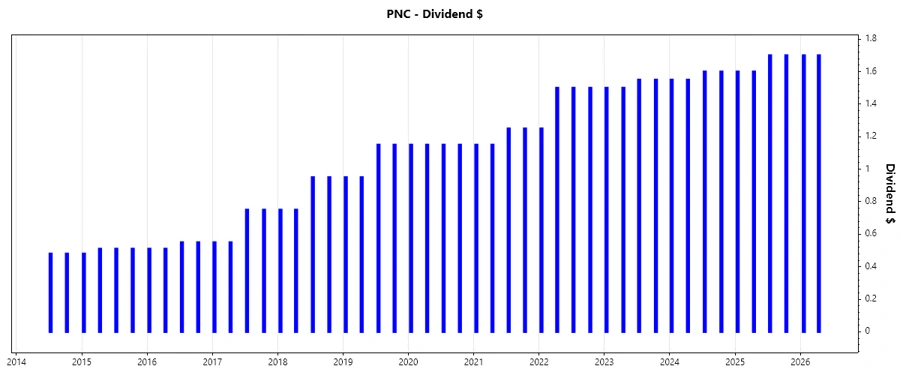
🔎 Dividend History
The importance of historical dividend payments is essential as they reflect the company's capacity and priority towards rewarding shareholders over time. PNC’s extensive dividend history highlights its commitment to returning capital to shareholders consistently.
| Year | Dividend per Share (USD) |
|---|---|
| 2026 | 3.4 |
| 2025 | 6.6 |
| 2024 | 6.3 |
| 2023 | 6.1 |
| 2022 | 5.75 |
📈 Dividend Growth
Dividend growth is a critical metric for assessing whether a company's dividends are increasing in line with earnings and overall financial health. PNC's growth figures portray a consistent rise demonstrative of underlying profitability enhancements.
| Time | Growth |
|---|---|
| 3 years | 4.70 % |
| 5 years | 7.49 % |
The average dividend growth is 7.49% over 5 years. This shows moderate but steady dividend growth.
💡 Payout Ratio
Payout ratios provide insight into how well earnings are being converted to dividends, and whether there is a risk of sustainability challenges. PNC's metrics indicate a well-managed balance between distributing dividends and retaining earnings for growth.
| Key figure | Ratio |
|---|---|
| EPS-based | 42.56 % |
| Free cash flow-based | 43.97 % |
The EPS payout ratio of 42.56% and FCF payout ratio of 43.97% suggest a sustainable approach, allowing room for capital reinvestment whilst rewarding shareholders.
💰 Cashflow & Capital Efficiency
Understanding cash flow dynamics and capital efficiency showcases the company's operational strength and ability to sustain dividend payouts through economic cycles.
| Year | 2025 | 2024 | 2023 |
|---|---|---|---|
| Free Cash Flow Yield | 5.33% | 10.24% | 16.28% |
| Earnings Yield | 8.43% | 7.65% | 8.98% |
| CAPEX to Operating Cash Flow | 0% | 0% | 0% |
| Stock-based Compensation to Revenue | 0% | 0% | 0% |
| Free Cash Flow / Operating Cash Flow Ratio | 100% | 100% | 100% |
| Return on Invested Capital | 5.27% | 4.47% | 4.03% |
The data reveals strong cash flow yields, indicating efficient capital use and robust support for dividend policies.
💳 Balance Sheet & Leverage Analysis
Examining leverage ratios is vital to gauge a firm's reliance on debt financing. A healthy balance sheet supports future growth and mitigates risks associated with economic downturns.
| Year | 2025 | 2024 | 2023 |
|---|---|---|---|
| Debt-to-Equity | 0.94 | 1.13 | 1.42 |
| Debt-to-Assets | 0.10 | 0.11 | 0.13 |
| Debt-to-Capital | 0.49 | 0.53 | 0.59 |
| Net Debt to EBITDA | 2.03 | 2.06 | 3.17 |
| Current Ratio | 0.11 | 0.15 | 0.23 |
| Quick Ratio | 0.11 | 0.15 | 0.23 |
| Financial Leverage | 9.47 | 10.29 | 10.99 |
The stability shown by steady leverage ratios highlights a controlled use of debt with sufficient buffer to manage obligations.
📈 Fundamental Strength & Profitability
Profitability indicators like ROE and ROA reflect the effectiveness of management strategies and the business’s capability in growing shareholder equity.
| Year | 2025 | 2024 | 2023 |
|---|---|---|---|
| Return on Equity | 11.45% | 10.82% | 10.91% |
| Return on Assets | 1.21% | 1.05% | 0.99% |
| Net Margin | 22.13% | 17.48% | 17.49% |
| EBIT Margin | 27.08% | 21.49% | 21.12% |
| EBITDA Margin | 27.36% | 22.26% | 21.80% |
Strong ROE and consistent profit margins reinforce The PNC Financial Services Group, Inc.’s profitability stance amidst market challenges.
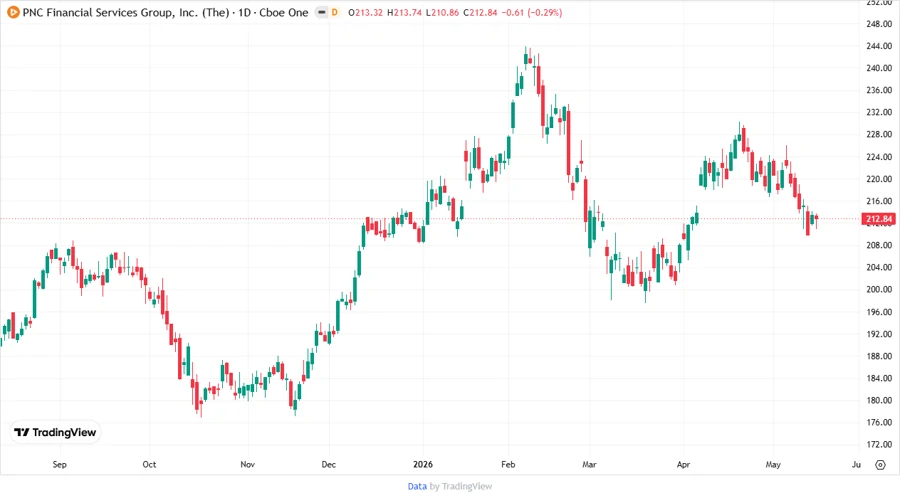
🔄 Price Development
🏆 Dividend Scoring System
| Criterion | Score | Score Bar |
|---|---|---|
| Dividend yield | 4 | |
| Dividend Stability | 5 | |
| Dividend growth | 3 | |
| Payout ratio | 4 | |
| Financial stability | 4 | |
| Dividend continuity | 5 | |
| Cashflow Coverage | 5 | |
| Balance Sheet Quality | 3 |
Overall Score: 33/40
🌟 Rating
The PNC Financial Services Group, Inc. receives a strong recommendation as a stable dividend-paying stock, given its historical reliability and consistent performance metrics. Investors seeking steady income streams will find PNC's dividend strength appealing. It is advised, however, to monitor market conditions and banking sector fluctuations to align with long-term financial goals.
Smart Data Insight
Master the Perfect Entry & Exit for this Stock
Don't leave your profits to chance. Historically, this stock follows specific seasonal patterns that institutional traders use to maximize returns.
- ✅ Identify the "Golden Buying Window"
- ✅ Avoid high-risk correction cycles
- ✅ Backtested data from the last 20+ years