April 12, 2026 a 07:46 am
PNC: Dividend Analysis - The PNC Financial Services Group, Inc.
The PNC Financial Services Group, Inc. has demonstrated a consistent dividend history, marked by a strong yield and a stable payout policy. Despite market volatility, PNC has maintained its dividend, showcasing resilience in the financial sector. This analysis will delve into the underlying metrics that form the backbone of PNC's dividend sustainability.
📊 Overview
PNC operates within the financial sector, a sphere both dynamic and reliably dividend-focused. The company's current dividend yield stands impressively at 3.08%, augmented by a generous $7.47 dividend per share. Over 42 years of consistent dividend history, with no record of cuts or suspensions recently, further attests to PNC's commitment to returning value to shareholders.
| Metric | Value |
|---|---|
| Sector | Financial |
| Dividend yield | 3.08% |
| Current dividend per share | 7.47 USD |
| Dividend history | 42 years |
| Last cut or suspension | None |
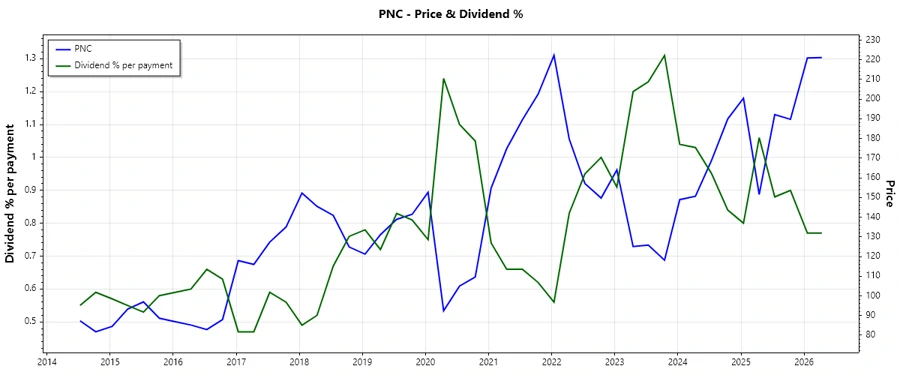
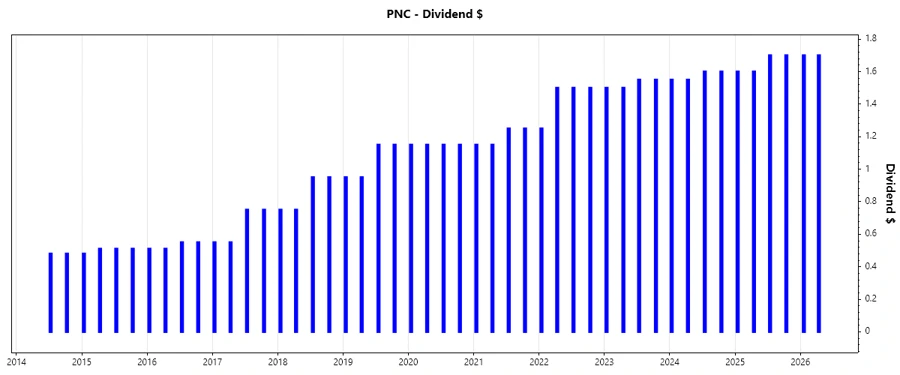
🗣️ Dividend History
Tracing PNC's dividend history reveals critical insights into its reliability and long-term promises to investors. Consistent dividends signal financial health and steady income for shareholders, crucial for those relying on dividends for income.
| Year | Dividend per Share |
|---|---|
| 2026 | 3.4 |
| 2025 | 6.6 |
| 2024 | 6.30 |
| 2023 | 6.10 |
| 2022 | 5.75 |
📈 Dividend Growth
Assessing dividend growth provides insight into the company's future distribution capabilities and financial health. PNC has fostered a respectable growth rate that bolsters investor confidence.
| Time | Growth |
|---|---|
| 3 years | 4.70% |
| 5 years | 7.49% |
The average dividend growth is 7.49% over 5 years. This shows moderate but steady dividend growth, which serves as an attractive aspect for long-term investors.
✅ Payout Ratio
A low payout ratio indicates a safe buffer to sustain dividends in future lean periods. Evaluating both EPS and FCF-based ratios provide a fuller picture of payout sustainability.
| Key figure | Ratio |
|---|---|
| EPS-based | 42.43% |
| Free cash flow-based | 50.97% |
The EPS payout ratio of 42.43% alongside a FCF payout ratio of 50.97% implies robust dividend coverage, ensuring dividends are well-supported by the company’s earnings and cash flows.
Cashflow & Capital Efficiency
Cash flows are the lifeblood of dividend payments, and understanding the company’s efficiency and capital management is paramount. Healthy cash flow metrics can signal the company’s capability to maintain and potentially grow dividends.
| Year | 2025 | 2024 | 2023 |
|---|---|---|---|
| Free Cash Flow Yield | 11.49% | 10.24% | 16.28% |
| Earnings Yield | 8.43% | 7.65% | 8.98% |
| CAPEX to Operating Cash Flow | 0 | 0 | 0 |
| Stock-based Compensation to Revenue | 0 | 0 | 0 |
| Free Cash Flow / Operating Cash Flow Ratio | 1 | 1 | 1 |
PNC's cash flow metrics indicate a healthy correlation between free cash flows and operating cash, highlighting strong capital efficiency and dividend sustainability.
Balance Sheet & Leverage Analysis
The balance sheet health significantly influences dividend policies. Sound leverage and liquidity ratios demonstrate the company’s ability to weather financial storms.
| Year | 2025 | 2024 | 2023 |
|---|---|---|---|
| Debt-to-Equity | 0.94 | 1.13 | 1.42 |
| Debt-to-Assets | 0.10 | 0.11 | 0.13 |
| Debt-to-Capital | 0.49 | 0.53 | 0.59 |
| Net Debt to EBITDA | 5.87 | 2.06 | 3.17 |
| Current Ratio | 0.81 | 0.15 | 0.23 |
| Quick Ratio | 0.81 | 0.15 | 0.23 |
| Financial Leverage | 9.47 | 10.29 | 10.99 |
The progression of PNC's leverage ratios signifies prudent risk management while elevating its capacity to enhance shareholder returns without sacrificing balance sheet strength.
Fundamental Strength & Profitability
Fundamental strength and profitability metrics provide insight into the company’s operational efficiency and capability for sustainable dividend distributions.
| Year | 2025 | 2024 | 2023 |
|---|---|---|---|
| Return on Equity | 11.45% | 10.82% | 10.91% |
| Return on Assets | 1.21% | 1.05% | 0.99% |
| Margins: Net | 22.13% | 17.48% | 17.49% |
| Margins: EBIT | 27.08% | 21.49% | 21.12% |
| Margins: EBITDA | 27.36% | 22.26% | 21.80% |
| Margins: Gross | 71.66% | 59.39% | 65.04% |
| R&D to Revenue | 0 | 0 | 0 |
The robust profitability metrics underscore PNC's operational excellence, essential for maintaining dividends and potential future enhancements.
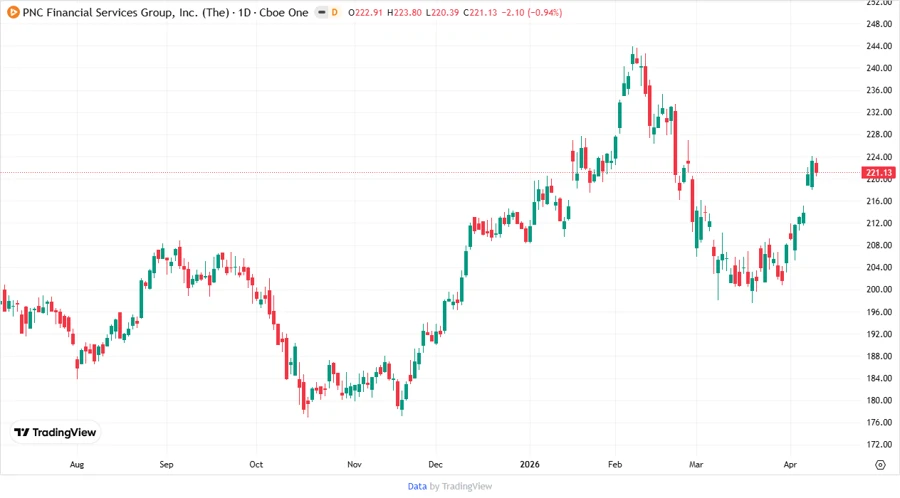
📉 Price Development
Dividend Scoring System
To evaluate PNC's dividend potential, we apply a comprehensive scoring model assessing yield, stability, and coverage among others, culminating in a singular indicative score.
| Criteria | Score (1-5) | Visual Score |
|---|---|---|
| Dividend yield | 4 | |
| Dividend Stability | 5 | |
| Dividend growth | 3 | |
| Payout ratio | 5 | |
| Financial stability | 4 | |
| Dividend continuity | 5 | |
| Cashflow Coverage | 4 | |
| Balance Sheet Quality | 4 |
Total Score: 34/40
Rating
Overall, The PNC Financial Services Group, Inc. presents a compelling dividend profile characterized by stable payouts, prudent financial management, and reliable historical growth. It offers substantial value for long-term income-focused investors. Based on the comprehensive analysis, this stock rates highly and can be recommended for inclusion in income-oriented portfolios, pending individual due diligence.