April 08, 2026 a 07:31 am

PNC: Dividend Analysis - The PNC Financial Services Group, Inc.
The PNC Financial Services Group, Inc. exhibits a robust dividend history with a steady growth trajectory over the years, reflecting its commitment to returning value to shareholders. With a dividend yield of 3.18% and a record of 42 years without a dividend cut, it stands as a testament to financial resilience. However, potential investors should be mindful of the macroeconomic conditions that might influence future payouts.
📊 Overview
Examining PNC's dividend profile reveals a reliable commitment to shareholder returns. Highlighted by a significant 42-year streak without suspension, the following table provides a snapshot of current dividend metrics:
| Metric | Value |
|---|---|
| Sector | Finance |
| Dividend yield | 3.18 % |
| Current dividend per share | 7.47 USD |
| Dividend history | 42 years |
| Last cut or suspension | None |
📈 Dividend History
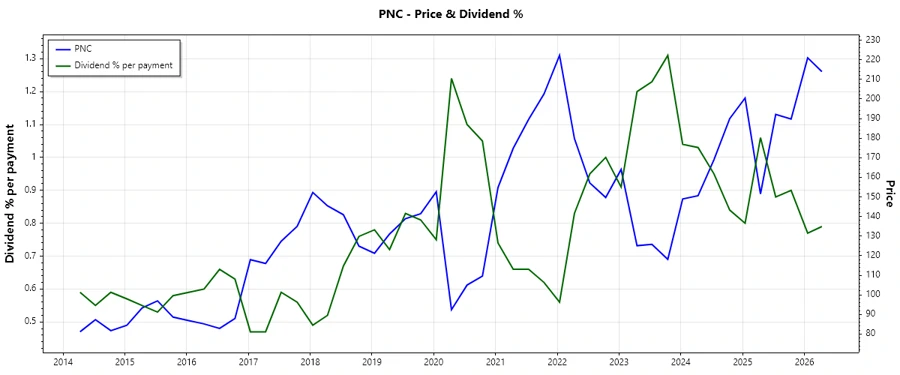
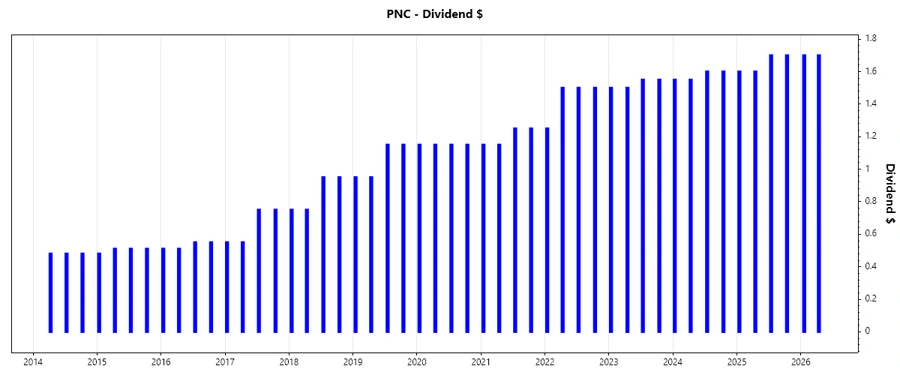
PNC has consistently increased its dividend payouts over the years, underscoring the company's stable financial footing and shareholder return strategy. Historical dividend data provides insight into PNC's financial discipline and future growth potential.
| Year | Dividend per Share (USD) |
|---|---|
| 2026 | 3.4 |
| 2025 | 6.6 |
| 2024 | 6.3 |
| 2023 | 6.1 |
| 2022 | 5.75 |
📈 Dividend Growth
Dividend growth is a crucial indicator of a company's financial health and ability to increase returns to shareholders over time. PNC demonstrates moderate but promising growth in recent years.
| Time | Growth |
|---|---|
| 3 years | 4.70 % |
| 5 years | 7.49 % |
The average dividend growth is 7.49 % over 5 years. This shows moderate but steady dividend growth. Such consistency is encouraging for income-focused investors.
💰 Payout Ratio
The payout ratio is an important metric that determines the sustainability of dividends. While the EPS-based payout ratio is at a moderate 42.43%, the free cash flow-based payout is higher, yet still within a manageable range of 50.97%.
| Key figure | Ratio |
|---|---|
| EPS-based | 42.43 % |
| Free cash flow-based | 50.97 % |
Overall, these ratios indicate a well-balanced approach to dividend payouts, suggesting PNC maintains adequate reserves to support its dividend strategy and accommodate future growth.
💵 Cashflow & Capital Efficiency
Understanding a company's cash flow performance and capital efficiency is vital to assessing its financial health and ability to sustain dividends. Here's a year-wise breakdown:
| Metric | 2025 | 2024 | 2023 |
|---|---|---|---|
| Free Cash Flow Yield | 11.49% | 10.24% | 16.28% |
| Earnings Yield | 8.43% | 7.65% | 8.98% |
| CAPEX to Operating Cash Flow | 0% | 0% | 0% |
| Stock-based Compensation to Revenue | 0% | 0% | 0% |
| Free Cash Flow / Operating Cash Flow Ratio | 100% | 100% | 100% |
These figures emphasize PNC's efficient capital deployment and its strong cash flow management, solidifying its ability to sustain and grow its dividends.
📉 Balance Sheet & Leverage Analysis
A solid balance sheet and manageable leverage are pivotal for a sustained dividend policy. The metrics below outline PNC's balance sheet health:
| Metric | 2025 | 2024 | 2023 |
|---|---|---|---|
| Debt-to-Equity | 0.94 | 1.13 | 1.42 |
| Debt-to-Assets | 0.10 | 0.11 | 0.13 |
| Debt-to-Capital | 0.49 | 0.53 | 0.59 |
| Net Debt to EBITDA | 5.87 | 2.06 | 3.17 |
| Current Ratio | 0.81 | 0.15 | 0.23 |
| Quick Ratio | 0.81 | 0.15 | 0.23 |
| Financial Leverage | 9.47 | 10.29 | 10.99 |
The data highlights a stable but cautious financial profile with increasing leverage indicators, which require monitoring for potential risk in a dynamic market environment.
✅ Fundamental Strength & Profitability
Assessing the company's profitability and efficiency metrics provides insight into its operational performance and readiness to address future challenges. Here's a snapshot:
| Metric | 2025 | 2024 | 2023 |
|---|---|---|---|
| Return on Equity | 11.45% | 10.82% | 10.91% |
| Return on Assets | 1.21% | 1.05% | 0.99% |
| Margins (Net) | 22.13% | 17.48% | 17.49% |
| EBIT Margin | 27.08% | 21.49% | 21.12% |
| EBITDA Margin | 27.36% | 22.26% | 21.80% |
| Gross Margin | 71.66% | 59.39% | 65.04% |
| R&D to Revenue | 0% | 0% | 0% |
PNC's substantial margins and returns provide confidence in its ability to maintain profitability and generate shareholder returns, albeit there's room for R&D enhancement.
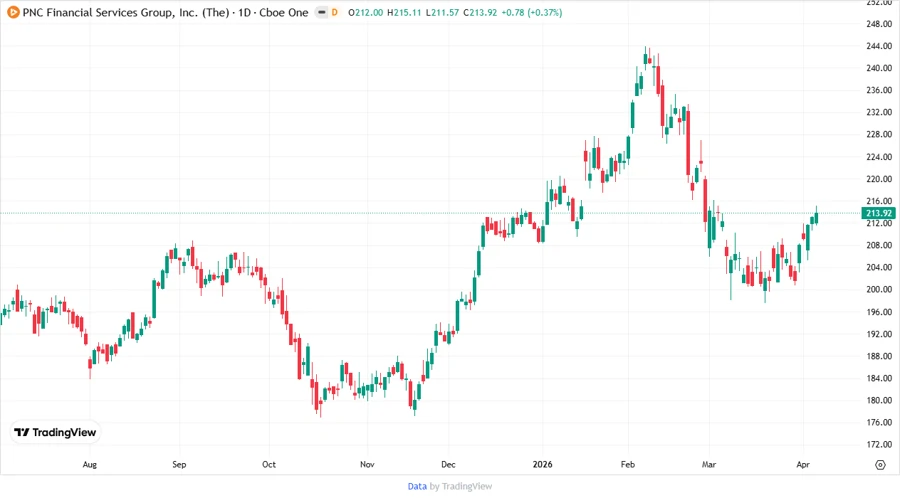
📊 Price Development
🔗 Dividend Scoring System
| Criteria | Score (0-5) | Score Bar |
|---|---|---|
| Dividend yield | 4 | |
| Dividend Stability | 5 | |
| Dividend growth | 4 | |
| Payout ratio | 4 | |
| Financial stability | 4 | |
| Dividend continuity | 5 | |
| Cashflow Coverage | 5 | |
| Balance Sheet Quality | 3 |
Total Score: 34/40
🏅 Rating
Given PNC's solid dividend track record underpinned by a stable financial foundation, moderate growth, and prudent payout ratios, The PNC Financial Services Group, Inc. merits a positive outlook. However, market conditions and increasing leverage warrant strategic monitoring. This stock offers a balanced opportunity for income-focused investors prioritizing yield and stability.
Smart Data Insight
Master the Perfect Entry & Exit for this Stock
Don't leave your profits to chance. Historically, this stock follows specific seasonal patterns that institutional traders use to maximize returns.
- ✅ Identify the "Golden Buying Window"
- ✅ Avoid high-risk correction cycles
- ✅ Backtested data from the last 20+ years