September 02, 2025 a 11:32 am


PNC: Dividend Analysis - The PNC Financial Services Group, Inc.
The PNC Financial Services Group, Inc. showcases a robust dividend profile, supported by a consistent 41-year history of dividend payments. With a current dividend yield of 3.38% and a steady growth over recent years, PNC presents a stable income opportunity for dividend investors. The company’s history of maintaining dividends through various economic cycles underlines its commitment to returning capital to shareholders.
📊 Overview
The PNC Financial Services Group operates within the financial sector, offering a dividend yield of 3.38%. Its current dividend per share stands at $7.24, sustained over 41 years of dividend history.
| Metric | Value |
|---|---|
| Sector | Financial |
| Dividend yield | 3.38 % |
| Current dividend per share | $7.24 USD |
| Dividend history | 41 years |
| Last cut or suspension | None |
📉 Dividend History
PNC's dividend history is a testament to its resilience and dedication to shareholder returns, with 41 consecutive years of dividend payments.
| Year | Dividend per Share (USD) |
|---|---|
| 2025 | 4.90 |
| 2024 | 6.30 |
| 2023 | 6.10 |
| 2022 | 5.75 |
| 2021 | 4.80 |
📈 Dividend Growth
The growth in PNC's dividends over the years illustrates its ability to increase shareholder returns consistently.
| Time | Growth |
|---|---|
| 3 years | 9.49% |
| 5 years | 8.44% |
The average dividend growth is 8.44% over 5 years. This shows moderate but steady dividend growth.
Payout Ratio
Evaluating payout ratios is crucial for understanding dividend sustainability. PNC maintains balanced ratios, ensuring operational viability while paying dividends.
| Key figure | Ratio |
|---|---|
| EPS-based | 46.30 % |
| Free cash flow-based | 50.80 % |
Both the 46.30% EPS-based ratio and 50.80% FCF-based ratio indicate a well-covered dividend, leaving room for reinvestment and stability.
Cashflow & Capital Efficiency
Analysis of the cashflow and capital efficiency metrics reveals insights into the operational robustness of PNC. Stability in free cash flows signals a strong financial footing.
| Metric | 2024 | 2023 | 2022 |
|---|---|---|---|
| Free Cash Flow Yield | 10.24% | 16.28% | 13.96% |
| Earnings Yield | 7.65% | 8.98% | 9.28% |
| CAPEX to Operating Cash Flow | 0% | 0% | 0% |
| Stock-based Compensation to Revenue | 0% | 0% | 0% |
| Free Cash Flow / Operating Cash Flow Ratio | 1 | 1 | 1 |
| Return on Invested Capital | 4.47% | 4.03% | 5.81% |
The company’s sound cash flow management and capital allocation efficiency underscore its resilience in diverse economic scenarios.
Balance Sheet & Leverage Analysis
Assessing the balance sheet measures is essential for gauging PNC's financial health and leverage.
| Metric | 2024 | 2023 | 2022 |
|---|---|---|---|
| Debt-to-Equity | 1.13 | 1.42 | 1.28 |
| Debt-to-Assets | 0.11 | 0.13 | 0.11 |
| Debt-to-Capital | 0.53 | 0.59 | 0.56 |
| Net Debt to EBITDA | 2.06 | 3.17 | 3.00 |
| Current Ratio | 0.15 | 0.23 | 0.19 |
| Quick Ratio | 0.15 | 0.23 | 0.19 |
| Financial Leverage | 10.29 | 10.99 | 12.17 |
With manageable leverage ratios and satisfactory liquidity levels, PNC's balance sheet reflects effective risk management.
Fundamental Strength & Profitability
An examination of profitability metrics offers insights into PNC's financial performance and operational efficiency.
| Metric | 2024 | 2023 | 2022 |
|---|---|---|---|
| Return on Equity | 10.82% | 10.91% | 13.20% |
| Return on Assets | 1.05% | 0.99% | 1.08% |
| Net Margin | 17.48% | 17.49% | 25.67% |
| EBIT Margin | 21.49% | 21.12% | 31.75% |
| EBITDA Margin | 22.26% | 21.80% | 34.52% |
| Gross Margin | 59.39% | 65.04% | 87.71% |
| R&D to Revenue | 0% | 0% | 0% |
PNC's impressive profitability margins and return metrics affirm its operational excellence and strategic positioning.
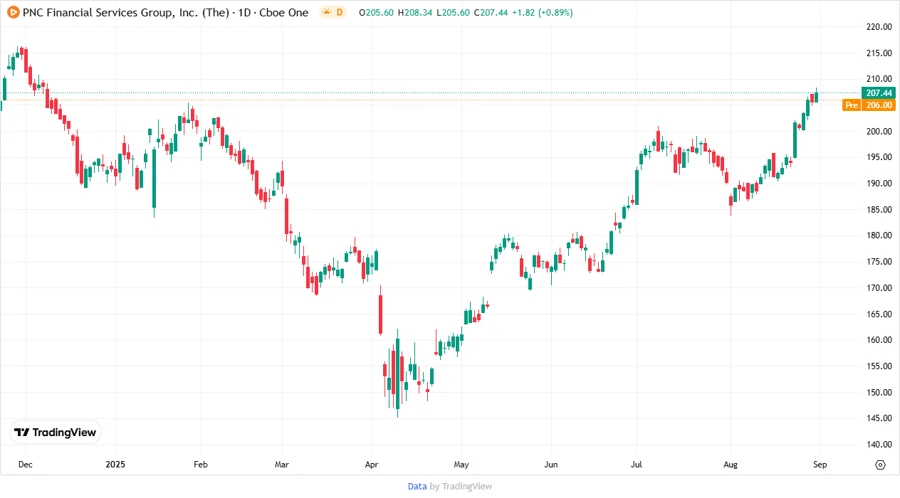
Price Development
Dividend Scoring System
This scoring system evaluates the robustness of PNC's dividend profile based on various financial metrics.
| Category | Score | Score Bar |
|---|---|---|
| Dividend yield | 4 | |
| Dividend Stability | 5 | |
| Dividend Growth | 4 | |
| Payout Ratio | 4 | |
| Financial Stability | 3 | |
| Dividend Continuity | 5 | |
| Cashflow Coverage | 4 | |
| Balance Sheet Quality | 3 |
Total Score: 32/40
Rating
✅ Overall Rating: With a strong dividend history, consistent growth, and solid fundamentals, The PNC Financial Services Group, Inc. emerges as a reliable option for dividend-oriented portfolios. While the financial stability indicators suggest potential areas for improvement, the overall dividend proposition remains attractive. We recommend a 'Buy' position, considering the stable income and growth prospects.
Smart Data Insight
Master the Perfect Entry & Exit for this Stock
Don't leave your profits to chance. Historically, this stock follows specific seasonal patterns that institutional traders use to maximize returns.
- ✅ Identify the "Golden Buying Window"
- ✅ Avoid high-risk correction cycles
- ✅ Backtested data from the last 20+ years