July 20, 2025 a 02:46 am


PNC: Dividend Analysis - The PNC Financial Services Group, Inc.
The PNC Financial Services Group, Inc., known for its substantial presence in the sector, offers a stable dividend yield of 4.22%. With an impressive history of 41 years of uninterrupted dividend payments, PNC has demonstrated resilience. The company shows consistent dividend growth, although moderate, indicating a commitment to shareholder returns.
📊 Overview
PNC, operating within the diverse financial services sector, maintains a reputable dividend profile. The current dividend per share stands at 7.24 USD, reflecting its dedication to rewarding investors consistently. With over four decades of dividend continuity and no recent cuts or suspensions, PNC is an attractive prospect for income-focused investors.
| Metric | Data |
|---|---|
| Sector | Financial Services |
| Dividend Yield | 4.22% |
| Current Dividend per Share | 7.24 USD |
| Dividend History | 41 years |
| Last Cut/Suspension | None |
📈 Dividend History
PNC's impressive 41-year history of dividend payments underscores its reliability. This long-standing practice signifies the company's focus on shareholder value. Examining recent dividend payments reveals consistent growth.
The dividends paid over the last five years show a commitment to increasing shareholder value:
| Year | Dividend per Share (USD) |
|---|---|
| 2025 | 4.9 |
| 2024 | 6.30 |
| 2023 | 6.10 |
| 2022 | 5.75 |
| 2021 | 4.80 |
📉 Dividend Growth
The dividend growth rate offers investors insight into future potential income increases. A steady rise indicates a company's ability to generate and distribute increasing cash flow to stakeholders.
| Time | Growth |
|---|---|
| 3 years | 9.49% |
| 5 years | 8.45% |
The average dividend growth is 8.45% over 5 years. This shows moderate but steady dividend growth, ensuring that investors see their income from dividends increasing over time.
✅ Payout Ratio
The payout ratio is a crucial indicator of dividend sustainability. An ideal payout ratio suggests that a company can comfortably support its dividend payments from earnings and free cash flow.
| Key figure | Ratio |
|---|---|
| EPS-based | 46.30% |
| Free cash flow-based | 51.03% |
With an EPS-based payout ratio of 46.30% and a free cash flow-based ratio of 51.03%, PNC is efficiently leveraging its profits to reward shareholders while maintaining sufficient capital for operations and growth.
💵 Cashflow & Capital Efficiency
Evaluating cash flow and capital efficiency ensures our comprehension of a company's operational health and its capacity to fund dividends and growth.
| Metric | 2022 | 2023 | 2024 |
|---|---|---|---|
| Free Cash Flow Yield | 13.96% | 16.28% | 10.24% |
| Earnings Yield | 9.28% | 8.98% | 7.65% |
| CAPEX to Operating Cash Flow | 0% | 0% | 0% |
| Stock-based Compensation to Revenue | 0% | 0% | 0% |
| Free Cash Flow / Operating Cash Flow Ratio | 1 | 1 | 1 |
The stability in the Free Cash Flow to Operating Cash Flow Ratio suggests efficient cash management, crucial for sustaining dividends and supporting internal investments.
📉 Balance Sheet & Leverage Analysis
Analyzing the balance sheet and leverage ratios helps in assessing the company's financial stability and its capacity to manage debt.
| Metric | 2022 | 2023 | 2024 |
|---|---|---|---|
| Debt-to-Equity | 1.28 | 1.42 | 1.13 |
| Debt-to-Assets | 0.11 | 0.13 | 0.11 |
| Debt-to-Capital | 0.56 | 0.59 | 0.53 |
| Net Debt to EBITDA | 3.00 | 3.17 | 2.06 |
| Current Ratio | 0.19 | 0.23 | 0.15 |
| Quick Ratio | 0.19 | 0.23 | 0.15 |
| Financial Leverage | 12.17 | 10.99 | 10.29 |
Despite a higher leverage ratio, adequate current and quick ratios highlight PNC's short-term financial strength and its ability to meet immediate obligations.
💪 Fundamental Strength & Profitability
Understanding fundamental strength and profitability is key to projecting future financial performance and assessing the efficiency of a company's operations.
| Metric | 2022 | 2023 | 2024 |
|---|---|---|---|
| Return on Equity | 13.20% | 10.91% | 10.82% |
| Return on Assets | 1.08% | 0.99% | 1.05% |
| Margins: Net | 25.67% | 17.49% | 17.48% |
| EBIT | 21.49% | 21.12% | 21.49% |
| EBITDA | 34.52% | 21.80% | 22.26% |
| Gross | 87.71% | 65.04% | 59.39% |
| Research & Development to Revenue | 0% | 0% | 0% |
Consistent margins and solid ROE assure investors of PNC's proficiency in converting operations into profit, bolstering investment confidence.
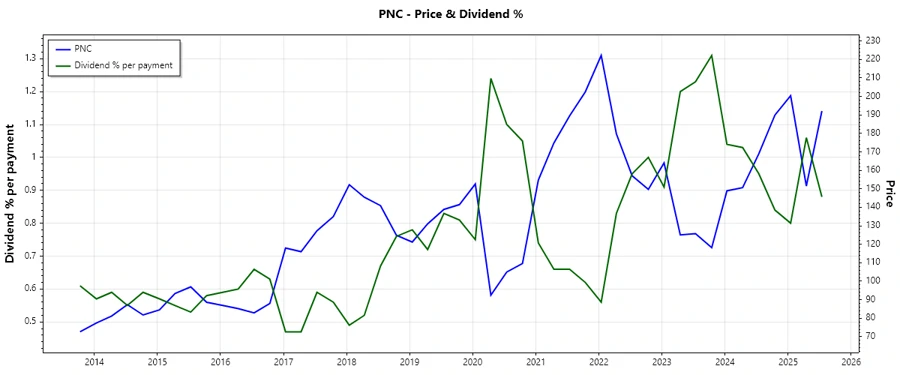
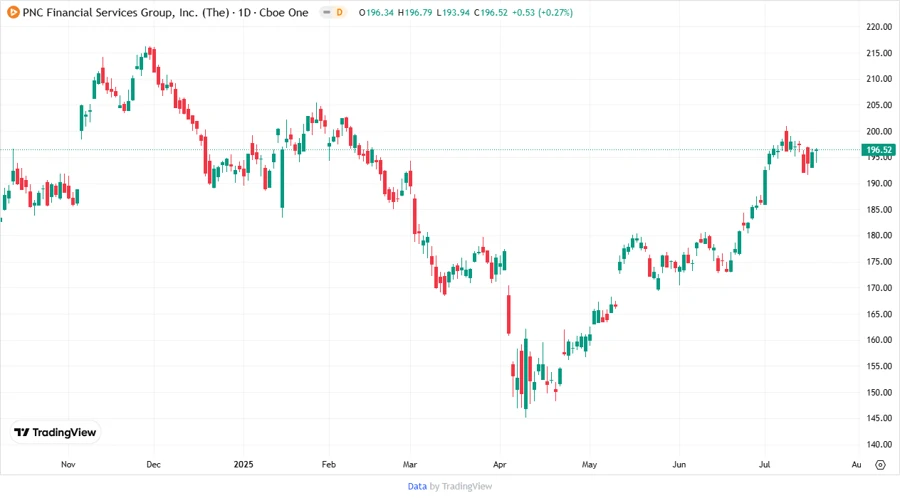
🗣️ Price Development
🔍 Dividend Scoring System
| Criteria | Score | Visualization |
|---|---|---|
| Dividend yield | 4 | |
| Dividend Stability | 5 | |
| Dividend growth | 3 | |
| Payout ratio | 4 | |
| Financial stability | 4 | |
| Dividend continuity | 5 | |
| Cashflow Coverage | 4 | |
| Balance Sheet Quality | 4 |
Total Score: 33/40
💡 Rating
The PNC Financial Services Group, with its robust dividend profile and strong financial metrics, is recommended as a strong buy for investors seeking steady income with growth potential. The company's disciplined financial management and commitment to dividends make it a valuable addition to any income-focused portfolio.
Smart Data Insight
Master the Perfect Entry & Exit for this Stock
Don't leave your profits to chance. Historically, this stock follows specific seasonal patterns that institutional traders use to maximize returns.
- ✅ Identify the "Golden Buying Window"
- ✅ Avoid high-risk correction cycles
- ✅ Backtested data from the last 20+ years