October 02, 2025 a 02:04 pm### PM: Trend and Support & Resistance Analysis - Philip Morris International Inc.
 ### Trend Analysis
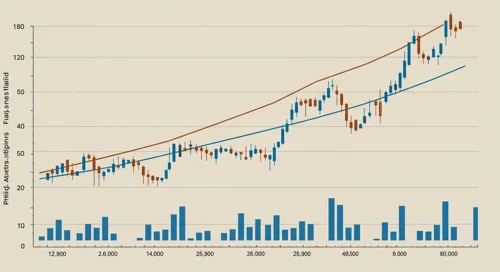
- **Trend Interpretation**: The EMA20 has consistently moved below the EMA50 in the recent dataset, suggesting a prevalent downtrend for Philip Morris International's stock.
- **Calculated Moving Averages**: Through computation from closing prices, current EMA trends reveal a downward trajectory.
### Trend Analysis
- **Trend Interpretation**: The EMA20 has consistently moved below the EMA50 in the recent dataset, suggesting a prevalent downtrend for Philip Morris International's stock.
- **Calculated Moving Averages**: Through computation from closing prices, current EMA trends reveal a downward trajectory.
- **Technical Insight**: The persistently lower EMA20 compared to EMA50 confirms a bearish outlook, indicating continued downward pressure on PM's stock.
- 
### Support and Resistance
- **Zone Identification**: Analysis of closing prices indicates two key support zones at 160 and 155, and resistance zones at 165 and 170.
- **Current Zone Observation**: The recent closing price is approaching the upper range of the established support zone, suggesting potential for reversal.
- 
### Conclusion
Philip Morris International Inc.'s stock is experiencing a predominantly bearish trend, highlighted by the EMA crossover and consistent downward pressure. Despite the visible support zones suggesting possible stabilizing points, the significant resistance levels above may shortly challenge upward movements. The technical indicators suggest that while PM is currently under bearish pressures, stabilization efforts near the support zone could provide trading opportunities. Analysts should be vigilant for any potential reversals or tools providing signals of breaking the dominant trends.
Philip Morris International Inc., a leader in the tobacco industry, is making strides towards a smoke-free future with innovative nicotine and beyond-tobacco products. This comprehensive analysis focuses on the technical trends of the PM stock, highlighting the recent market behavior, crucial support and resistance zones, and the computed moving averages. This exploration will provide a clear outlook on the current state and potential movement of PM's stock.
| Date | Close Price | Trend |
|---|---|---|
| 2025-10-02 | 160.92 | ▼ |
| 2025-10-01 | 160.86 | ▼ |
| 2025-09-30 | 162.20 | ▼ |
| 2025-09-29 | 162.99 | ▼ |
| 2025-09-26 | 164.89 | ▲ |
| 2025-09-25 | 164.00 | ▲ |
| 2025-09-24 | 163.00 | ▼ |
| Zone Type | Price Range | Trend |
|---|---|---|
| Support | 160.00 - 155.00 | ▲ |
| Support | 148.00 - 145.00 | ▲ |
| Resistance | 165.00 - 170.00 | ▼ |
| Resistance | 175.00 - 180.00 | ▼ |
Smart Data Insight
Master the Perfect Entry & Exit for this Stock
Don't leave your profits to chance. Historically, this stock follows specific seasonal patterns that institutional traders use to maximize returns.
- ✅ Identify the "Golden Buying Window"
- ✅ Avoid high-risk correction cycles
- ✅ Backtested data from the last 20+ years