September 28, 2025 a 08:15 am

PM: Trend and Support & Resistance Analysis - Philip Morris International Inc.
Philip Morris International Inc. shows resilience amidst the evolving market dynamics as it shifts focus towards smoke-free products. With a robust strategy aimed at delivering a smoke-free future, the company is well-positioned in the global market. However, the stock's recent technical indicators suggest a potential reversal, requiring continuous monitoring to identify optimal entry and exit points.
Trend Analysis
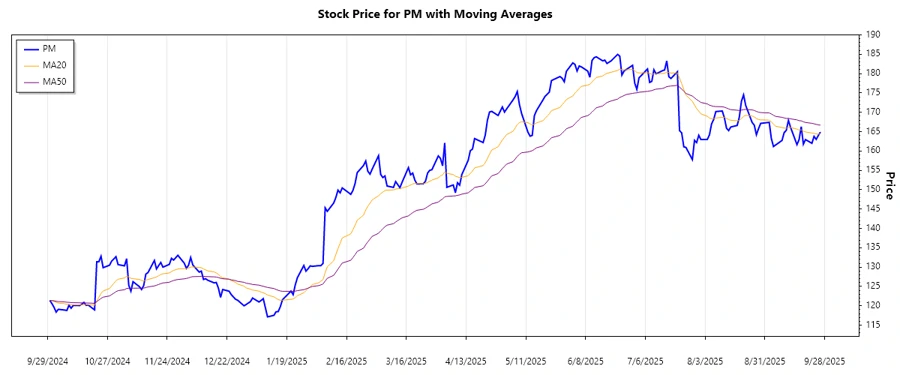
The recent analysis of Philip Morris International Inc. (Ticker: PM) reveals a fluctuating trend over the past months. Calculating the Exponential Moving Averages (EMA), we find the following results:
| Date | Close Price | Trend |
|---|---|---|
| 2025-09-26 | 164.89 | ▲ Up ▲ |
| 2025-09-25 | 164.00 | ⚖️ Sideways ⚖️ |
| 2025-09-24 | 163.00 | ▼ Down ▼ |
| 2025-09-23 | 163.77 | ▼ Down ▼ |
| 2025-09-22 | 161.98 | ▼ Down ▼ |
| 2025-09-19 | 162.95 | ▲ Up ▲ |
| 2025-09-18 | 161.76 | ⚖️ Sideways ⚖️ |
The presence of a mixed trend with subtle movements indicates minor bearish pressures. Looking at the EMAs, the stock is hovering around neutral terrain, suggesting a wait-and-see approach until a definitive trend emerges.
Support and Resistance
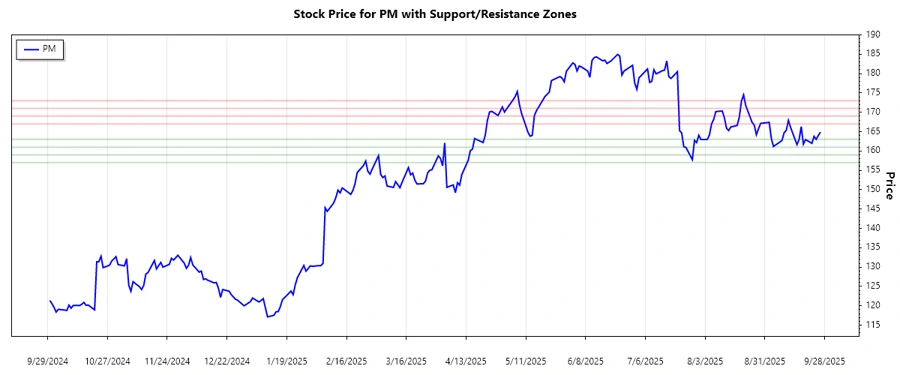
Analyzing support and resistance levels, we identify crucial zones based on historical price behavior.
| Type | From | To |
|---|---|---|
| Support Zone 1 | 161.00 | 163.00 |
| Support Zone 2 | 157.00 | 159.00 |
| Resistance Zone 1 | 167.00 | 169.00 |
| Resistance Zone 2 | 171.00 | 173.00 |
The current price is approaching the Support Zone 1, indicating a potential bounce back opportunity. Investors should monitor for breakouts or bounces within these zones for strategic trade setups.
Conclusion
Philip Morris International Inc. is navigating a delicate phase marked by a mix of upward and downward pressures in its stock price. The company's strategic shift towards smoke-free products is promising, potentially mitigating some risks associated with traditional tobacco products. However, technical indicators suggest cautious positioning, as the stock oscillates near key support levels. For analysts, the stock presents opportunities for strategic entry on identified support zones and potential upside from resistance interactions. Potential investors should weigh the broader industry trends and company's strategic initiatives against these technical signals.
Smart Data Insight
Master the Perfect Entry & Exit for this Stock
Don't leave your profits to chance. Historically, this stock follows specific seasonal patterns that institutional traders use to maximize returns.
- ✅ Identify the "Golden Buying Window"
- ✅ Avoid high-risk correction cycles
- ✅ Backtested data from the last 20+ years