
September 11, 2025 a 01:15 pm
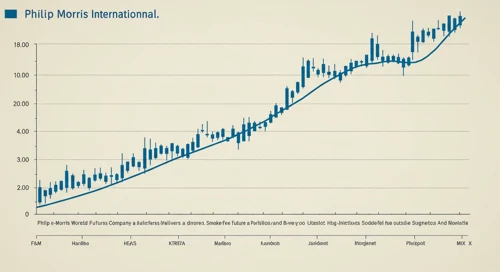


PM: Trend and Support & Resistance Analysis - Philip Morris International Inc.
Philip Morris International Inc. (PM) is experiencing a dynamic market environment as it continues its transition towards a smoke-free future. Investors show interest in its ability to diversify its product offerings and sustain financial growth amid changing regulatory landscapes. With technological innovations and expanding geographic presence, PM remains a key player in the tobacco industry.
Trend Analysis
| Date | Close Price | Trend |
|---|---|---|
| Sep 10, 2025 | 165.31 | ▼ Abwärtstrend |
| Sep 09, 2025 | 164.74 | ▼ Abwärtstrend |
| Sep 08, 2025 | 162.72 | ▼ Abwärtstrend |
| Sep 05, 2025 | 161.55 | ▼ Abwärtstrend |
| Sep 04, 2025 | 161.15 | ▼ Abwärtstrend |
| Sep 03, 2025 | 163.22 | ▼ Abwärtstrend |
| Sep 02, 2025 | 167.40 | ▲ Aufwärtstrend |
The current trend for PM stock indicates a predominant ▼ Abwärtstrend, as the EMA20 is below the EMA50. This suggests continued downward pressure on the price.
Support and Resistance
| Zone | Range | |
|---|---|---|
| Resistance Zone 1 | 170.00 to 172.00 | ▲ |
| Resistance Zone 2 | 175.00 to 177.00 | ▲ |
| Support Zone 1 | 162.00 to 164.70 | ▼ |
| Support Zone 2 | 159.00 to 161.00 | ▼ |
The price is currently trending within a support zone, indicating potential buying interest at the prevailing levels.
Conclusion
The recent analysis of Philip Morris International Inc. (PM) stock illustrates a prevailing ▼ downward trend, signifying potential challenges in achieving short-term price appreciation. However, strategic buying in the identified support zones may offer potential opportunities. Investors should remain cautious yet optimistic as PM advances towards a smoke-free product line, which awaits significant regulatory support. This combination of technical evaluation and corporate strategy suggests a moderate-risk scenario with potential long-term upside for stakeholders.
Smart Data Insight
Master the Perfect Entry & Exit for this Stock
Don't leave your profits to chance. Historically, this stock follows specific seasonal patterns that institutional traders use to maximize returns.
- ✅ Identify the "Golden Buying Window"
- ✅ Avoid high-risk correction cycles
- ✅ Backtested data from the last 20+ years