April 20, 2026 a 05:15 am
PM: Fibonacci Analysis - Philip Morris International Inc.
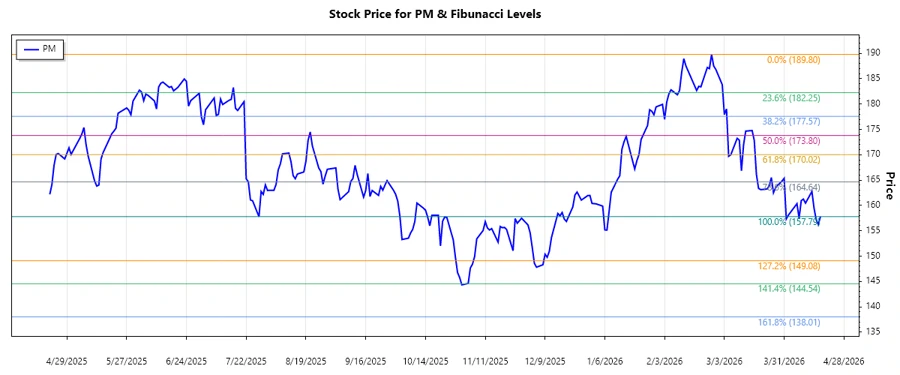
Philip Morris International Inc. (ticker: PM) has seen varied trends in its stock price over recent months. The company, known for its tobacco products, is transitioning to smoke-free alternatives, which have shown promise in its international markets. Despite facing challenges in regulatory environments and changing consumer preferences, Philip Morris remains a robust player in the industry with a diversified portfolio. Analyzing its recent stock trends gives insight into potential technical support and resistance levels.
Fibonacci Analysis
| Attribute | Detail |
|---|---|
| Trend Type | Downtrend |
| Start Date | 2026-02-25 |
| End Date | 2026-04-17 |
| High Point | $189.80 on 2026-02-25 |
| Low Point | $157.79 on 2026-04-17 |
| Fibonacci 23.6% | $165.67 |
| Fibonacci 38.2% | $171.47 |
| Fibonacci 50.0% | $173.80 |
| Fibonacci 61.8% | $176.13 |
| Fibonacci 78.6% | $179.76 |
| Current Price | $157.79 |
| Retracement Zone | None |
| Interpretation | Currently, the stock is below Fibonacci retracement levels, indicating a potential future support at lower levels. |
Conclusion
The analysis of Philip Morris International Inc. indicates a downturn in stock prices from February to April 2026. While the company continues to push into smoke-free products, the volatile market presents both challenges and opportunities. The Fibonacci retracement analysis identifies potential support levels; however, the current price remains below these, suggesting continued bearish sentiment. Analysts should watch for stabilization around key technical levels. Future developments in regulatory approval and consumer acceptance will be crucial in shaping stock performance. This scenario alerts technical traders to potential buying opportunities if support levels hold.