November 24, 2025 a 11:44 am
PM: Fibonacci Analysis - Philip Morris International Inc.
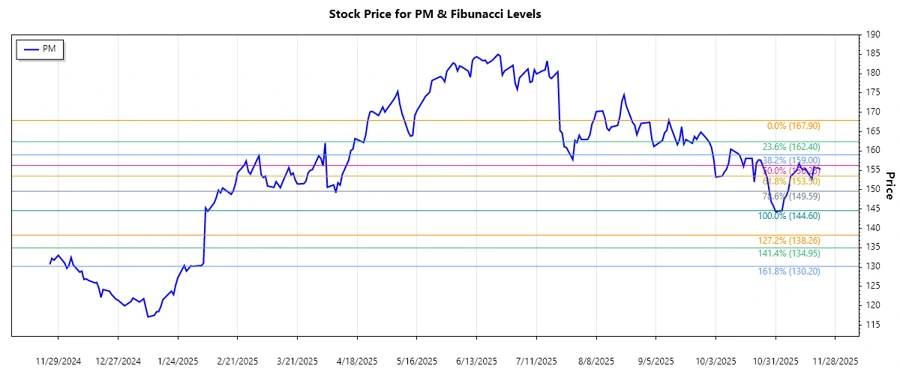
Philip Morris International Inc. is poised at a critical juncture as it transitions towards a smoke-free product line. The recent stock trend reflects investor sentiment as the company expands its portfolio beyond traditional tobacco products. This pivot towards innovative, non-combustible alternatives could be a strategic move to capture shifting market demands. Technical indicators suggest potential points of support and resistance crucial for future price directions, as we examine the latest trend in the stock price.
Fibonacci Analysis
| Details | Information |
|---|---|
| Trend Start Date | 2025-09-11 |
| Trend End Date | 2025-11-21 |
| High Point | $167.90 on 2025-09-11 |
| Low Point | $144.60 on 2025-11-03 |
| Fibonacci Level 0.236 | $149.57 |
| Fibonacci Level 0.382 | $152.48 |
| Fibonacci Level 0.5 | $156.25 |
| Fibonacci Level 0.618 | $160.01 |
| Fibonacci Level 0.786 | $165.48 |
| Current Price | $155.24 |
| Retracement Zone | 0.382 |
| Technical Interpretation | The current price is within the 0.382 Fibonacci retracement level, indicating potential resistance at this level. A breakthrough above this level could suggest renewed bullish momentum, while resistance could indicate a continuation of the consolidation phase. |
Conclusion
Philip Morris International Inc. is navigating a transformative period marked by evolving product lines and strategic market positioning. The technical analysis, armed with Fibonacci retracement levels, highlights key support and resistance zones that adept traders should monitor closely. While aiming for innovative product offerings, the company faces technical resistance which could provoke either stabilization or bullish momentum. Investors should remain mindful of both the inherent risks and opportunities associated with Philip Morris's transition efforts and market performance.
Smart Data Insight
Master the Perfect Entry & Exit for this Stock
Don't leave your profits to chance. Historically, this stock follows specific seasonal patterns that institutional traders use to maximize returns.
- ✅ Identify the "Golden Buying Window"
- ✅ Avoid high-risk correction cycles
- ✅ Backtested data from the last 20+ years