October 17, 2025 a 04:45 pm
PM: Fibonacci Analysis - Philip Morris International Inc.
Philip Morris International Inc. has shown a recent downward trend. Amidst a transformative phase aiming for a smoke-free future, the company's stock volatility can be attributed to evolving market dynamics and strategic shifts. Investors should consider both the potential of new product lines and the risks associated with transitioning away from traditional tobacco sales.
Fibonacci Analysis
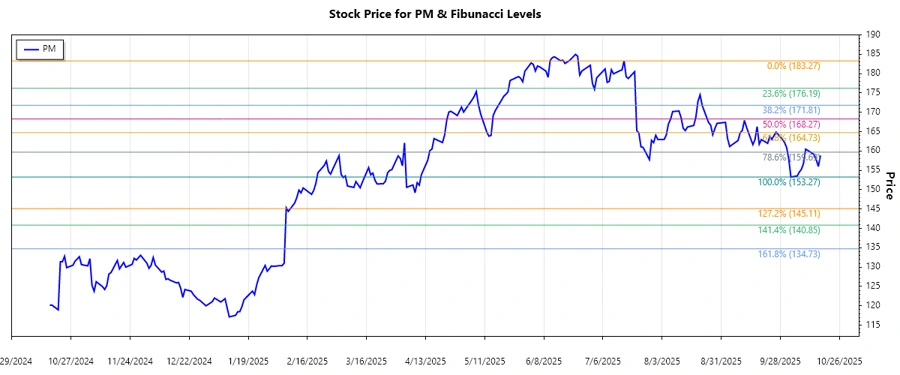
Based on the recent price data review, the Philip Morris stock demonstrates a downward trend with specific retracement levels identified. A detailed look into the price movements helps in understanding potential price support and resistance for future trading.
| Parameter | Details |
|---|---|
| Trend Duration | July 16, 2025 - October 17, 2025 |
| High Point | $183.27 (July 16, 2025) |
| Low Point | $153.27 (October 3, 2025) |
| Fibonacci Levels |
|
| Current Price | $158.84 (October 17, 2025) - Below the lowest retracement zone. |
Interpretation: The current price is outside the retracement range, indicating a possible continuation of the downward trend. Historically, this can suggest further downside potential unless a significant support level forms.
Conclusion
Philip Morris International Inc. is navigating a transformative market landscape as it transitions towards smoke-free products. Although recent stock prices reflect a downtrend, strategic positioning in innovative products could provide long-term growth. Investors should weigh the competitive challenges and market acceptance of new products against the traditional revenue streams. Analysts suggest monitoring support levels closely as continued declines could provide buying opportunities if confidence in the company's strategy aligns with market recovery.
Smart Data Insight
Master the Perfect Entry & Exit for this Stock
Don't leave your profits to chance. Historically, this stock follows specific seasonal patterns that institutional traders use to maximize returns.
- ✅ Identify the "Golden Buying Window"
- ✅ Avoid high-risk correction cycles
- ✅ Backtested data from the last 20+ years