September 13, 2025 a 10:15 am

PM: Fibonacci Analysis - Philip Morris International Inc.
Philip Morris International Inc. has shown significant market performance with recent fluctuations. The analysis suggests a potential opportunity for investors as the stock tests critical Fibonacci retracement levels, marking potential support areas. As the company transitions towards a smoke-free future, the stock reflects both the opportunities in reduced-risk products and the challenges posed by shifting market dynamics.
Fibonacci Analysis
| Data Point | Details | ||||||||||||
|---|---|---|---|---|---|---|---|---|---|---|---|---|---|
| Start Date | 2025-01-13 | ||||||||||||
| End Date | 2025-09-12 | ||||||||||||
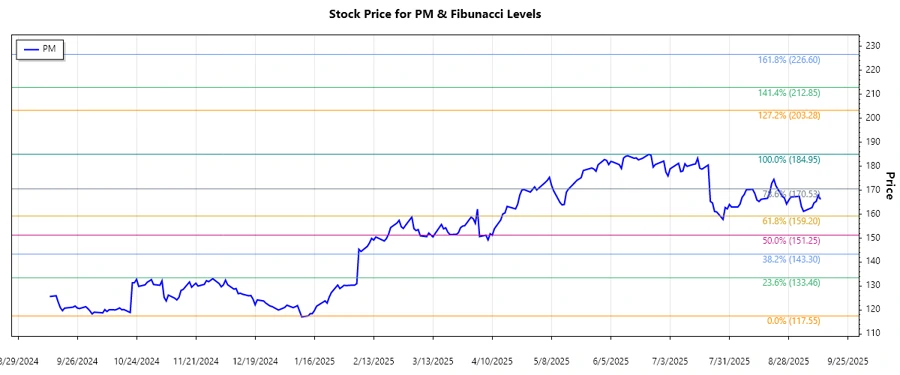
| High Price | 184.95 (2025-06-23) | ||||||||||||
| Low Price | 117.55 (2025-01-13) | ||||||||||||
| Fibonacci Levels |
|
||||||||||||
| Current Price Analysis | The current price of 166.11 is in the 0.786 retracement zone. This suggests a potential resistance level and traders should monitor for any reversal patterns. | ||||||||||||
| Interpretation | The stock's proximity to the 0.786 level indicates potential resistance. A break above could signal further upward momentum or potential trend reversal at this significant Fibonacci level. |
Conclusion
The analysis of Philip Morris International Inc. reflects a complex interplay of market forces as the company transitions to a smoke-free product line. The current price, nearing significant Fibonacci levels, offers a crucial understanding for traders and investors about possible resistance or support zones. Investors should weigh the company's strategic shift against potential market volatility. The technical picture suggests vigilance against abrupt market changes, underscoring the need for strategic positioning amid ongoing industry transformation.
Smart Data Insight
Master the Perfect Entry & Exit for this Stock
Don't leave your profits to chance. Historically, this stock follows specific seasonal patterns that institutional traders use to maximize returns.
- ✅ Identify the "Golden Buying Window"
- ✅ Avoid high-risk correction cycles
- ✅ Backtested data from the last 20+ years