June 13, 2026 a 07:46 am


PM: Dividend Analysis - Philip Morris International Inc.
Philip Morris International Inc. presents a robust dividend profile, underscored by its consistent payments over the last 19 years. The company stands as a compelling choice for income-focused investors, despite its high payout ratios. However, challenges related to net debt and return metrics may necessitate cautious optimism.
📊 Overview
Philip Morris operates in a competitive consumer goods sector, offering a modest dividend yield of 3.19%. Despite a hefty current dividend per share of 5.54 USD and nearly two decades of uninterrupted dividend history, the last cut or suspension remains notably absent, reflecting strong historical stability.
| Metric | Value |
|---|---|
| Sector | Consumer Goods |
| Dividend yield | 3.19% |
| Current dividend per share | 5.54 USD |
| Dividend history | 19 years |
| Last cut or suspension | None |
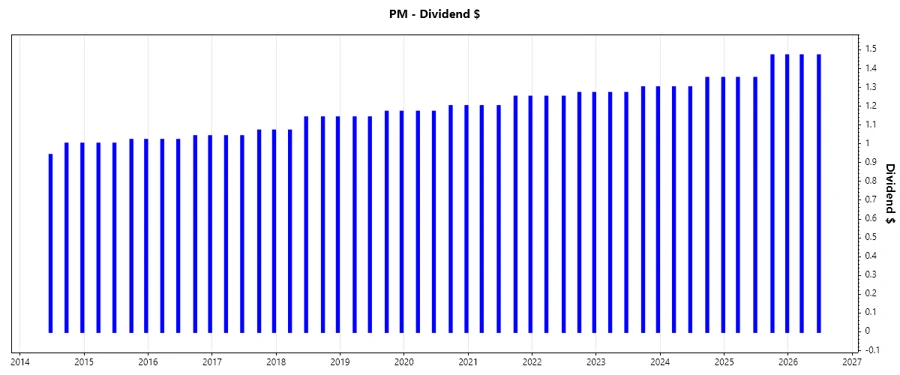
🔍 Dividend History
The dividend history of Philip Morris conveys reliability, an essential factor for long-term income investors. With uninterrupted increases, dividends serve as a hedge against inflation cumulatively enhancing shareholder value.
| Year | Dividend per Share (USD) |
|---|---|
| 2026 | 2.94 |
| 2025 | 5.64 |
| 2024 | 5.30 |
| 2023 | 5.14 |
| 2022 | 5.04 |
📈 Dividend Growth
The modest growth rates of 3.82% over 3 years and 3.54% over 5 years suggest stable dividend enhancement. The average dividend growth of 3.54% over 5 years reflects the company's strong commitment to rewarding its shareholders, albeit cautiously.
| Time | Growth |
|---|---|
| 3 years | 3.82% |
| 5 years | 3.54% |
The average dividend growth is 3.54% over 5 years. This shows moderate but steady dividend growth.
✅ Payout Ratio
It is critical to maintain a sustainable payout ratio to ensure dividend sustainability. Philip Morris's current payout ratios exceed typical comfort zones, with 78.06% based on EPS and 80.99% based on FCF, indicating potential risks if financial performance declines.
| Key figure | Ratio |
|---|---|
| EPS-based | 78.06% |
| Free cash flow-based | 80.99% |
Given the high payout ratio of 78.06% (EPS) and 80.99% (FCF), caution is advised as these levels may limit the company's financial flexibility in adverse market conditions.
💵 Cashflow & Capital Efficiency
Analyzing cash flow and capital efficiency helps determine a company's operational efficiency and ability to fund dividends. While Philip Morris maintains commendable cash flow yields against its operating cash flow, the CAPEX to operating cash flow ratio indicates restrained growth investment.
| Metric | 2023 | 2024 | 2025 |
|---|---|---|---|
| Free Cash Flow Yield | 5.40% | 5.76% | 4.27% |
| Earnings Yield | 5.34% | 3.76% | 4.55% |
| CAPEX to Operating Cash Flow | 14.35% | 11.82% | 12.83% |
| Stock-based Compensation to Revenue | 0% | 0% | 0% |
| Free Cash Flow / Operating Cash Flow Ratio | 85.65% | 88.18% | 87.17% |
The strong Free Cash Flow yields demonstrate a sustained capacity to support dividends. However, a more controlled CAPEX to Operating Cash Flow suggests stability over aggressive expansion, aligning with a mature revenue archetype.
📝 Balance Sheet & Leverage Analysis
A thorough leverage assessment is crucial for understanding financial durability and liquidity risk. Despite stable operating performance, Philip Morris shows an elevated debt profile, attributed partly to strategic acquisitions or investments.
| Metric | 2023 | 2024 | 2025 |
|---|---|---|---|
| Debt-to-Equity | 426.81% | 388.89% | 488.64% |
| Debt-to-Assets | 73.36% | 73.96% | 70.59% |
| Debt-to-Capital | 130.60% | 134.61% | 125.73% |
| Net Debt to EBITDA | 3.35 | 2.63 | 2.52 |
| Current Ratio | 0.75 | 0.88 | 0.96 |
| Quick Ratio | 0.34 | 0.47 | 0.51 |
| Financial Leverage | 581.77% | 525.82% | 692.27% |
The high leverage ratios point toward significant debt dependencies, yet indicate judicious management strategies to maintain liquidity. Continuous monitoring is suggested to manage financial risks.
📈 Fundamental Strength & Profitability
Philip Morris's fundamental metrics reveal mixed profitability performance, possibly impacted by sector challenges or internal restructuring efforts. Still, margins reflect feasible competitive positioning.
| Metric | 2023 | 2024 | 2025 |
|---|---|---|---|
| Return on Equity | -69.41% | -59.86% | -113.55% |
| Return on Assets | 11.93% | 11.38% | 16.40% |
| Return on Invested Capital | 19.76% | 25.44% | 25.56% |
| Net Profit Margin | 22.15% | 18.57% | 27.92% |
| EBIT Margin | 34.05% | 36.86% | 38.05% |
| EBITDA Margin | 38.02% | 41.58% | 42.96% |
| Gross Margin | 63.35% | 64.81% | 67.12% |
| R&D to Revenue | 0% | 2.00% | 0% |
The negative Return on Equity is reflective of significant accounting adjustments or high debt. Marginal improvements in operating margins signal efficient cost management amid pricing pressure.
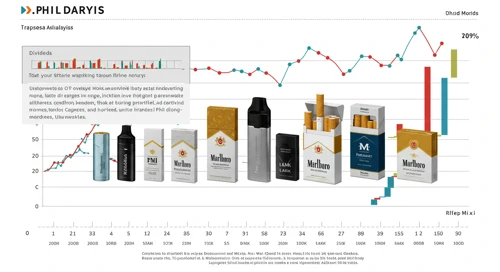
💹 Price Development
🏆 Dividend Scoring System
| Category | Score | |
|---|---|---|
| Dividend yield | 4 | |
| Dividend Stability | 5 | |
| Dividend growth | 3 | |
| Payout ratio | 2 | |
| Financial stability | 3 | |
| Dividend continuity | 5 | |
| Cashflow Coverage | 4 | |
| Balance Sheet Quality | 3 |
Overall Score: 29/40
⭐ Rating
Philip Morris International Inc. exhibits a solid but challenging dividend profile. While it provides a substantive yield and demonstrates strong dividend continuity, high payout ratios and leverage present potential risks. Suitable actions are recommended for investors prioritizing income sustainability with a moderate risk tolerance. Continued monitoring of financial metrics and market conditions is advised.
Smart Data Insight
Master the Perfect Entry & Exit for this Stock
Don't leave your profits to chance. Historically, this stock follows specific seasonal patterns that institutional traders use to maximize returns.
- ✅ Identify the "Golden Buying Window"
- ✅ Avoid high-risk correction cycles
- ✅ Backtested data from the last 20+ years