
May 28, 2026 a 02:46 am
PM: Dividend Analysis - Philip Morris International Inc.
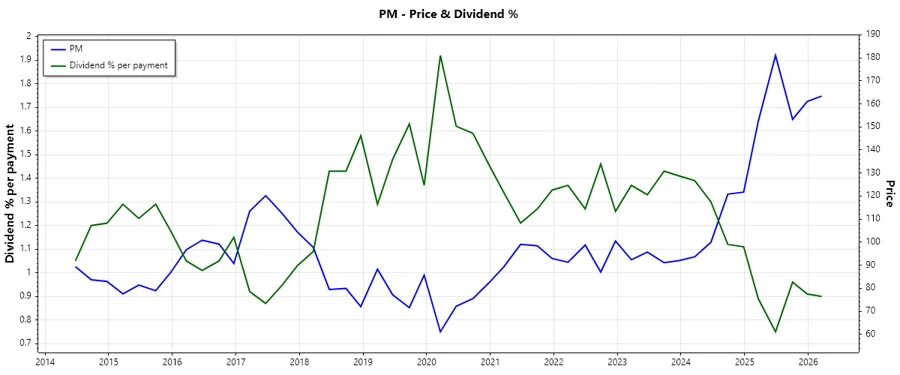
Philip Morris International Inc. presents a stable dividend yield with consistent payments over the past years. The company's commitment to sustaining its dividend is evident, although challenges such as high payout ratios and debt levels must be monitored closely.
Overview
Philip Morris operates within the Tobacco sector, offering a moderate dividend yield supported by a track record of stable dividend payments.
| Metric | Value |
|---|---|
| Sector | Tobacco |
| Dividend yield | 3.53% |
| Current dividend per share | 5.54 USD |
| Dividend history | 19 years |
| Last cut or suspension | None |
Dividend History
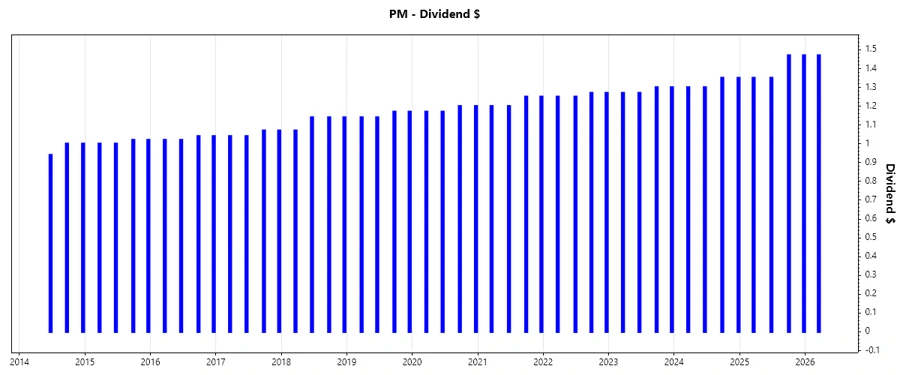
With 19 years of dividend history, the reliability of Philip Morris' dividend payments underlines its commitment to shareholders, which is a crucial factor for income investors.
| Year | Dividend per Share (USD) |
|---|---|
| 2026 | 1.47 |
| 2025 | 5.64 |
| 2024 | 5.30 |
| 2023 | 5.14 |
| 2022 | 5.04 |
Dividend Growth
The dividend growth metric is a key indicator of a company's potential to increase payouts. Philip Morris exhibits slow but steady growth trends, a positive sign for long-term investors seeking income inflation protection.
| Time | Growth |
|---|---|
| 3 years | 3.82% |
| 5 years | 3.54% |
The average dividend growth is 3.54% over 5 years. This shows moderate but steady dividend growth.
Payout Ratio
Payout Ratios are pivotal for assessing dividend sustainability. High payout ratios might indicate limited potential for dividend growth or increased risk of cuts if earnings decline.
| Key figure | Ratio |
|---|---|
| EPS-based | 78.06% |
| Free cash flow-based | 80.99% |
With an EPS payout ratio of 78.06% and a free cash flow payout ratio of 80.99%, the current payouts suggest a careful balance, though closely approaching thresholds that may restrict growth flexibility.
Cashflow & Capital Efficiency
Cashflow stability and capital efficiency are crucial for sustaining dividends and reinvesting for growth. Philip Morris' metrics reflect its capability to generate and manage cash, an essential underpinning for robust dividend policies.
| Year | 2025 | 2024 | 2023 |
|---|---|---|---|
| Free Cash Flow Yield | 4.27% | 5.76% | 5.40% |
| Earnings Yield | 4.55% | 3.76% | 5.34% |
| CAPEX to Operating Cash Flow | 12.86% | 11.82% | 14.35% |
| Stock-based Compensation to Revenue | 0% | 0% | 0% |
| Free Cash Flow / Operating Cash Flow Ratio | 87.17% | 88.18% | 85.65% |
The cash flow and capital efficiency ratios are indicative of Philip Morris' ability to produce ample cash flow, reinforcing confidence in its dividend continuity despite ongoing allocations to CAPEX.
Balance Sheet & Leverage Analysis
A strong balance sheet supports dividend sustainability by managing leverage effectively. For Philip Morris, the debt profile requires scrutiny, but certain ratios exhibit manageable levels, underlining operational efficiency.
| Year | 2025 | 2024 | 2023 |
|---|---|---|---|
| Debt-to-Equity | -4.89 | -3.89 | -4.27 |
| Debt-to-Assets | 70.59% | 73.96% | 73.36% |
| Debt-to-Capital | 125.73% | 134.61% | 130.60% |
| Net Debt to EBITDA | 2.52 | 2.63 | 3.35 |
| Current Ratio | 0.96 | 0.88 | 0.75 |
| Quick Ratio | 0.51 | 0.47 | 0.34 |
| Financial Leverage | -6.92 | -5.26 | -5.82 |
The financial leverage and other ratios suggest higher-than-average debt levels, which require cautious monitoring to avert potential strains on the balance sheet that could affect dividend payouts.
Fundamental Strength & Profitability
Profitability metrics give essential insights into operational efficiency and competitive positioning, both of which bolster confidence in Philip Morris' dividend payment abilities.
| Year | 2025 | 2024 | 2023 |
|---|---|---|---|
| Return on Equity | -113.55% | -59.86% | -69.41% |
| Return on Assets | 16.40% | 11.38% | 11.93% |
| Margins: Net | 27.91% | 18.57% | 22.15% |
| Margins: EBIT | 38.05% | 36.86% | 34.05% |
| Margins: EBITDA | 42.96% | 41.58% | 38.02% |
| Margins: Gross | 67.12% | 64.81% | 63.35% |
| R&D to Revenue | 0% | 0% | 0% |
Despite negative return on equity indicating challenges, solid profit margins highlight efficiency and competitive advantage, essential for sustained dividends.
Price Development
Dividend Scoring System
| Criteria | Score | Score Bar |
|---|---|---|
| Dividend yield | 4 | |
| Dividend Stability | 4 | |
| Dividend growth | 3 | |
| Payout ratio | 3 | |
| Financial stability | 2 | |
| Dividend continuity | 4 | |
| Cashflow Coverage | 4 | |
| Balance Sheet Quality | 2 |
Total Score: 26/40
Rating
Philip Morris International Inc. maintains a solid dividend profile with a consistent yield. While there are concerns over its high leverage and payout ratios, the company's commitment to sustaining and growing its dividend, paired with its cash flow generation, earns it a cautious yet positive outlook. The stock could be suitable for income-focused investors willing to accept the inherent risks associated with its financial structure.
Smart Data Insight
Master the Perfect Entry & Exit for this Stock
Don't leave your profits to chance. Historically, this stock follows specific seasonal patterns that institutional traders use to maximize returns.
- ✅ Identify the "Golden Buying Window"
- ✅ Avoid high-risk correction cycles
- ✅ Backtested data from the last 20+ years