May 11, 2026 a 07:46 am


PM: Dividend Analysis - Philip Morris International Inc.
Philip Morris International Inc. has demonstrated a strong commitment to delivering steady dividends to its shareholders. With a dividend yield of 3.53% and a 19-year history of consecutive payments, the company exemplifies reliability in dividend distribution. The lack of any recent dividend cuts or suspensions further strengthens investor confidence.
📊 Overview
Philip Morris operates within the consumer goods sector, specifically focusing on tobacco products. The company offers a current dividend per share of 5.54 USD, representing robust financial health and distribution capacity. A history of 19 uninterrupted years of dividend payments showcases stability. Importantly, Philip Morris has not experienced any recent dividend reductions or suspensions, indicating consistent financial management.
| Metric | Value |
|---|---|
| Sector | Consumer Goods |
| Dividend yield | 3.53% |
| Current dividend per share | 5.54 USD |
| Dividend history | 19 years |
| Last cut or suspension | None |
🗣️ Dividend History
Understanding the dividend history is crucial for assessing the company's commitment to returning value to its shareholders. Consistency in historical payments often indicates sound financial health and strategic resource allocation.
| Year | Dividend per Share (USD) |
|---|---|
| 2026 | 1.47 |
| 2025 | 5.64 |
| 2024 | 5.30 |
| 2023 | 5.14 |
| 2022 | 5.04 |
📈 Dividend Growth
Monitoring dividend growth is essential for identifying the company’s future earnings potential and shareholder value enhancement strategies. For Philip Morris, the dividend growth rate of 3.82% over the past 3 years and 3.54% over 5 years indicates sustained growth.
| Time | Growth |
|---|---|
| 3 years | 3.82% |
| 5 years | 3.54% |
The average dividend growth is 3.54% over 5 years. This shows moderate but steady dividend growth.
⚠️ Payout Ratio
The payout ratio is a meaningful indicator of dividend sustainability. It compares dividend payments to the company's earnings, revealing how comfortably a company can maintain dividend payouts from its earnings base.
| Key figure | Ratio |
|---|---|
| EPS-based | 78.06% |
| Free cash flow-based | 80.99% |
The current payout ratios suggest that the dividends are adequately supported by earnings and cash flows. The EPS-based ratio of 78.06% and an FCF-based ratio of 80.99% indicate that the company is attentively balancing shareholder returns with sustainable financial practices.
🏦 Cashflow & Capital Efficiency
Cashflow analysis ensures the company's ability to support operations and returns on investments while maintaining liquidity. It also sheds light on capital allocation efficiency.
| Year | 2023 | 2024 | 2025 |
|---|---|---|---|
| Free Cash Flow Yield | 5.40% | 5.76% | 5.43% |
| Earnings Yield | 5.34% | 3.76% | 4.45% |
| CAPEX to Operating Cash Flow | 14.35% | 11.82% | 12.83% |
| Stock-based Compensation to Revenue | 0% | 0% | 0% |
| Free Cash Flow / Operating Cash Flow Ratio | 85.65% | 88.18% | 87.17% |
The steady free cash flow and effective capital deployment strategies indicate robustness in operational cash management, despite varying earnings yields. The company’s CAPEX investments reflect prudent infrastructure enhancement efforts contributing to sustainable growth.
📈 Balance Sheet & Leverage Analysis
Balance sheet strength is a critical marker of financial health, evaluating the company's debt obligations and its capacity to cover short-term liabilities.
| Year | 2023 | 2024 | 2025 |
|---|---|---|---|
| Debt-to-Equity | -4.27 | -3.89 | -4.89 |
| Debt-to-Assets | 73.36% | 73.96% | 70.59% |
| Debt-to-Capital | 130.60% | 134.61% | 125.73% |
| Net Debt to EBITDA | 3.35 | 2.63 | 2.52 |
| Current Ratio | 0.75 | 0.88 | 0.96 |
| Quick Ratio | 0.34 | 0.47 | 0.51 |
| Financial Leverage | -5.82 | -5.26 | -6.92 |
Philip Morris’s leverage indicators, coupled with its liquidity ratios, suggest a high level of indebtedness with moderate liquidity management proficiency. These ratios necessitate caution and vigilant monitoring to ensure optimized debt practices.
🏋️♂️ Fundamental Strength & Profitability
Fundamental analysis focuses on a company’s core performance metrics, assessing its efficiency in utilizing resources to generate profits.
| Year | 2023 | 2024 | 2025 |
|---|---|---|---|
| Return on Equity | -69.41% | -59.86% | -113.55% |
| Return on Assets | 11.93% | 11.38% | 16.40% |
| Margins: Net | 22.15% | 18.57% | 27.92% |
| Margins: EBIT | 34.05% | 36.86% | 38.05% |
| Margins: EBITDA | 38.02% | 41.58% | 42.96% |
| Margins: Gross | 63.35% | 64.81% | 67.12% |
| Research & Development to Revenue | 0% | 2.00% | 0% |
Despite displaying strong asset efficiency return metrics, Philip Morris's high negative return on equity figures reflect volatile equity-based profitability, posing an element of risk in long-term shareholder value accretion strategies. Operationally, the high gross and EBITDA margins underline effective cost management and high product margin aspects.
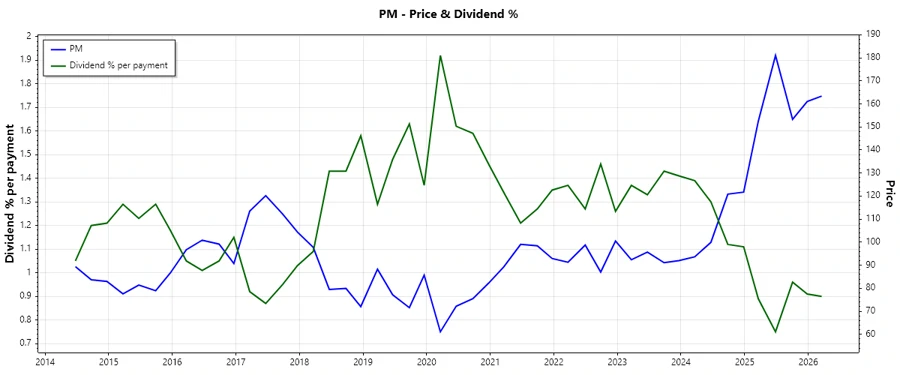
💹 Price Development
✅ Dividend Scoring System
| Category | Score | Indicator |
|---|---|---|
| Dividend yield | 4 | |
| Dividend Stability | 5 | |
| Dividend growth | 3 | |
| Payout ratio | 4 | |
| Financial stability | 3 | |
| Dividend continuity | 5 | |
| Cashflow Coverage | 3 | |
| Balance Sheet Quality | 3 |
Overall Score: 30/40
🗣️ Rating
Philip Morris International Inc. emerges as a reliable and consistent dividend payer with a historical streak of 19 years. While its fundamental metrics reflect strong cashflow generation capabilities, attention should be paid to its leverage and return on equity challenges. As a result, it warrants a cautious "Buy" recommendation for dividend-focused investors seeking income stability.
Smart Data Insight
Master the Perfect Entry & Exit for this Stock
Don't leave your profits to chance. Historically, this stock follows specific seasonal patterns that institutional traders use to maximize returns.
- ✅ Identify the "Golden Buying Window"
- ✅ Avoid high-risk correction cycles
- ✅ Backtested data from the last 20+ years