July 31, 2025 a 07:46 am


📊 PM: Dividend Analysis - Philip Morris International Inc.
Philip Morris International Inc., a key player in the tobacco industry, demonstrates a robust dividend profile with consistent payouts over two decades. The company's dividend yield positions it as an attractive option for income-focused investors. Despite its high payout ratios, especially concerning EPS, its longstanding dividend history suggests a commitment to returning value to shareholders.
Overview
Philip Morris operates within the consumer goods sector, manifesting a notable position within the global market. Its dividend yield stands at 2.98%, reflecting a stable return for investors. The current dividend per share is $5.27, underscoring its substantial payout capabilities. With 18 years of uninterrupted dividend history and no recent cuts or suspensions, Philip Morris solidifies its reputation for reliability.
| Description | Value |
|---|---|
| Sector | Consumer Goods |
| Dividend Yield | 2.98 % |
| Current Dividend Per Share | 5.27 USD |
| Dividend History | 18 years |
| Last Cut or Suspension | None |
🗣️ Dividend History
Maintaining an 18-year streak of dividend payments, Philip Morris showcases its commitment to shareholders. The absence of any cuts or suspensions in this duration reflects financial stability and operational predictability, pivotal aspects that drive investor confidence.
| Year | Dividend per Share (USD) |
|---|---|
| 2025 | 2.70 |
| 2024 | 5.30 |
| 2023 | 5.14 |
| 2022 | 5.04 |
| 2021 | 4.90 |
📈 Dividend Growth
Philip Morris's dividend growth is a reflection of its financial strategy to incrementally reward its investors. The 3-year growth rate is at 2.65%, while the 5-year growth rate shows a slight improvement at 2.78%.
| Time | Growth |
|---|---|
| 3 years | 2.65 % |
| 5 years | 2.78 % |
The average dividend growth is 2.78% over 5 years. This shows moderate but steady dividend growth, aligning with a conservative approach to shareholder value increment.
✅ Payout Ratio
Payout ratios are crucial indicators of dividend sustainability. The EPS-based payout ratio is alarmingly high at 99.96%, suggesting limited room to maintain dividends without strong earnings. The FCF-based ratio is slightly better at 91.34%, yet still indicates a strain on cash reserves.
| Key Figure | Ratio |
|---|---|
| EPS-based | 99.96 % |
| Free Cash Flow-based | 91.34 % |
These ratios highlight Philip Morris's aggressive dividend policy, which may hinder reinvestment opportunities if earned income doesn't stay robust or grow further.
📊 Cashflow & Capital Efficiency
Analyzing cash flow dynamics, critical to understanding a company's operational efficiency, shows the adaptability of Philip Morris under various financial pressures. Key metrics like Free Cash Flow Yield and Earnings Yield provide insights into reinvestment and competitive positioning.
| Year | 2024 | 2023 | 2022 |
|---|---|---|---|
| Free Cash Flow Yield | 5.76% | 5.39% | 6.20% |
| Earnings Yield | 3.76% | 5.34% | 5.77% |
| CAPEX to Operating Cash Flow | 11.82% | 14.35% | 9.97% |
| Stock-based Compensation to Revenue | N/A | N/A | 0.58% |
| Free Cash Flow / Operating Cash Flow Ratio | 88.18% | 85.65% | 90.03% |
The company's cash flow generation remains robust and highlights efficient allocation of capital. However, stock compensation stood out in 2022, affecting profitability ratios minimally, yet it is not significant enough to impact dividend reliability.
🗣️ Balance Sheet & Leverage Analysis
Evaluating the balance sheet is essential for assessing Philip Morris's risk profile. Higher debt levels compared to equity suggest leveraged risk that necessitates careful liquidity management.
| Year | 2024 | 2023 | 2022 |
|---|---|---|---|
| Debt-to-Equity Ratio | -3.89 | -4.27 | -4.81 |
| Debt-to-Assets Ratio | 0.74 | 0.73 | 0.70 |
| Debt-to-Capital Ratio | 1.35 | 1.31 | 1.26 |
| Net Debt to EBITDA | 2.63 | 3.35 | 2.96 |
| Current Ratio | 1.63 | 1.75 | 1.72 |
| Quick Ratio | 0.47 | 0.34 | 0.36 |
| Financial Leverage | -5.26 | -5.82 | -6.89 |
Despite its strong cash position, leverage ratios highlight potential risks. Maintenance of current debt levels requires careful attention to revenue streams to ensure financial balance remains uninterrupted.
📊 Fundamental Strength & Profitability
Philip Morris's fundamental analysis outlines the company's efficiency in operations and profitability, which supports its dividend policy and operational strategies.
| Year | 2024 | 2023 | 2022 |
|---|---|---|---|
| Return on Equity | -59.86% | -69.41% | -101.02% |
| Return on Assets | 11.38% | 11.93% | 14.67% |
| Margins: Net | 18.57% | 22.15% | 28.49% |
| Margins: EBIT | 36.86% | 34.05% | 39.05% |
| Margins: EBITDA | 41.58% | 38.02% | 42.44% |
The high margins and robust ROA figures suggest operational efficiency, however, declining ROE necessitates focus on capital structure optimization to leverage existing assets for better returns.
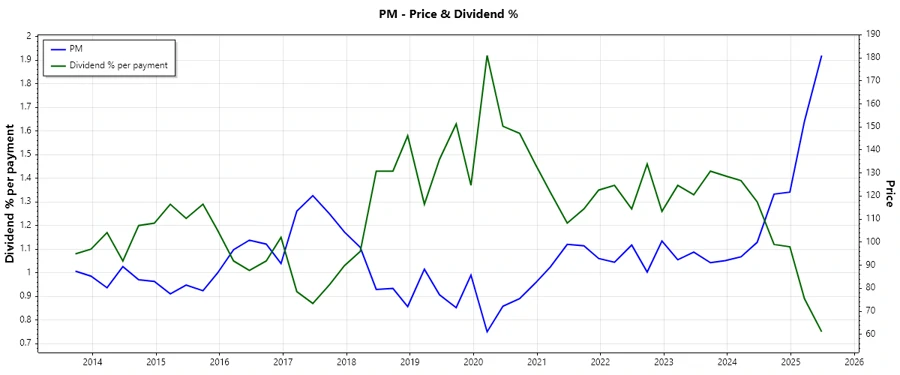
Price Development
📈 Dividend Scoring System
| Category | Score | Rating |
|---|---|---|
| Dividend yield | 4 | |
| Dividend Stability | 5 | |
| Dividend growth | 3 | |
| Payout ratio | 2 | |
| Financial stability | 4 | |
| Dividend continuity | 5 | |
| Cashflow Coverage | 3 | |
| Balance Sheet Quality | 2 |
Total Score: 28/40
✅ Rating
Philip Morris International Inc. demonstrates a solid dividend-paying legacy with reasonable growth indications, albeit with leverage concerns that necessitate cautious optimism from investors. The overall dividend strategy is sustainable given continued earning strengths, making it a viable option for investors targeting consistent yields within the consumer goods space.
Smart Data Insight
Master the Perfect Entry & Exit for this Stock
Don't leave your profits to chance. Historically, this stock follows specific seasonal patterns that institutional traders use to maximize returns.
- ✅ Identify the "Golden Buying Window"
- ✅ Avoid high-risk correction cycles
- ✅ Backtested data from the last 20+ years