July 08, 2025 a 11:31 am


PM: Dividend Analysis - Philip Morris International Inc.
Philip Morris International Inc. provides an attractive dividend profile with a consistent history of payments. The company's generous yield, combined with its commitment to returning value to shareholders, makes it an interesting choice for income-focused investors. However, it is also important to evaluate the sustainability of these dividends given the current payout ratio and financial health.
📊 Overview
| Metric | Details |
|---|---|
| Sector | Consumer Staples |
| Dividend Yield | 2.98% |
| Current Dividend per Share | 5.27 USD |
| Dividend History | 18 Years |
| Last Cut or Suspension | None |
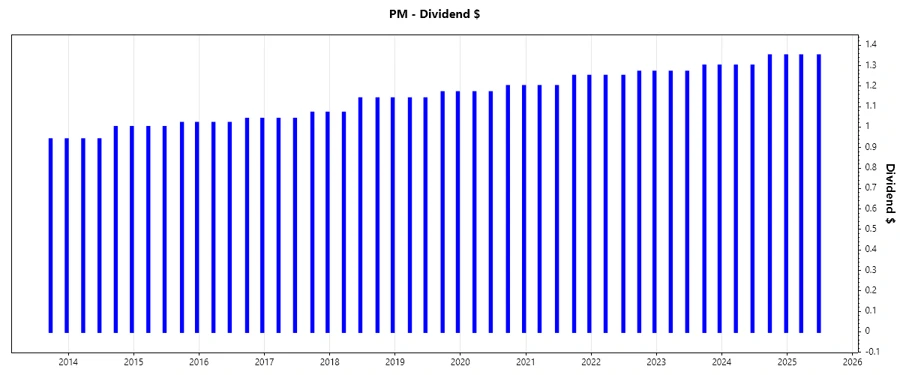
📉 Dividend History
Philip Morris has a solid track record of dividend payments, providing stability to shareholders. The history is critical for evaluating the company's commitment and ability to deliver shareholder returns consistently.
| Year | Dividend per Share (USD) |
|---|---|
| 2025 | 2.70 |
| 2024 | 5.30 |
| 2023 | 5.14 |
| 2022 | 5.04 |
| 2021 | 4.90 |
📈 Dividend Growth
The growth of dividends is indicative of a company's profitability and financial health. It provides assurance to investors that management can sustain and potentially increase payments in the future.
| Time | Growth |
|---|---|
| 3 years | 2.65% |
| 5 years | 2.78% |
The average dividend growth is 2.78% over 5 years. This shows moderate but steady dividend growth.
⚖️ Payout Ratio
Payout ratios help in understanding the sustainability of dividends. High ratios may indicate over-distribution, potentially leading to future cuts.
| Key figure | Ratio |
|---|---|
| EPS-based | 107.87% |
| Free Cash Flow-based | 80.53% |
The elevated EPS payout ratio of 107.87% suggests that dividends might not be sustainable in the long term, whereas the FCF payout ratio is within a more moderate range.
💵 Cashflow & Capital Efficiency
Assessing cash flow and capital efficiency reveals the company's ability to generate cash and reinvest it profitably, crucial for sustainable dividend payments.
| Year | 2024 | 2023 | 2022 |
|---|---|---|---|
| Free Cash Flow Yield | 5.76% | 5.40% | 6.20% |
| Earnings Yield | 3.76% | 5.34% | 5.77% |
| CAPEX to Operating Cash Flow | 11.82% | 14.35% | 9.97% |
| Stock-based Compensation to Revenue | 0.00% | 0.00% | 0.58% |
| Free Cash Flow / Operating Cash Flow Ratio | 88.18% | 85.65% | 90.03% |
The consistency in Free Cash Flow/Operating Cash Flow Ratio shows stable cash flow generation abilities.
📊 Balance Sheet & Leverage Analysis
A deep dive into leverage ratios and balance sheet analysis is critical to understanding a company's financial stability and risk associated with its debt levels.
| Year | 2024 | 2023 | 2022 |
|---|---|---|---|
| Debt-to-Equity | -3.89 | -4.27 | -4.81 |
| Debt-to-Assets | 73.96% | 73.36% | 69.91% |
| Debt-to-Capital | 134.61% | 130.60% | 126.22% |
| Net Debt to EBITDA | 2.56 | 3.35 | 2.89 |
| Current Ratio | 0.88 | 0.75 | 0.72 |
| Quick Ratio | 0.47 | 0.34 | 0.36 |
| Financial Leverage | -5.26 | -5.82 | -6.89 |
The company's leverage positions are considerably negative, inducing potential financial risk despite stable debt-to-assets ratios.
🌟 Fundamental Strength & Profitability
Analyzing profitability and fundamental strength indicators provides insights into the company's operational efficiency and capability to generate earnings.
| Year | 2024 | 2023 | 2022 |
|---|---|---|---|
| Return on Equity | -0.60 | -0.69 | -1.01 |
| Return on Assets | 11.38% | 11.93% | 14.67% |
| Margins: Net | 18.57% | 22.15% | 28.49% |
| Margins: EBIT | 36.86% | 34.05% | 39.69% |
| Return on Invested Capital | 25.13% | 21.71% | 23.84% |
The profitability indicators exhibit robust operational efficiency, though net revenue margins are under pressure.
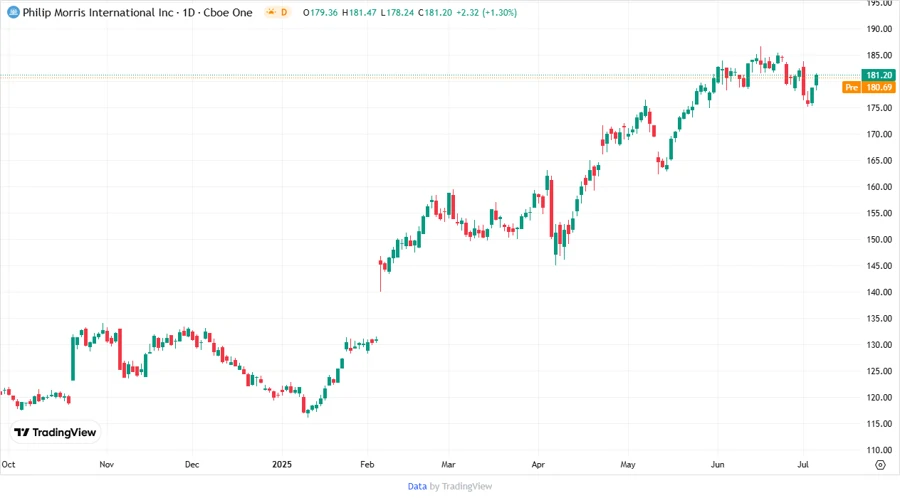
Price Development
📈 Dividend Scoring System
| Category | Score | |
|---|---|---|
| Dividend Yield | 4 | |
| Dividend Stability | 5 | |
| Dividend Growth | 3 | |
| Payout Ratio | 2 | |
| Financial Stability | 2 | |
| Dividend Continuity | 4 | |
| Cashflow Coverage | 4 | |
| Balance Sheet Quality | 2 |
Overall Score: 26/40
Rating
Philip Morris International Inc. offers a strong dividend yield with stable payments, though some concerns arise from high payout ratios and negative leverage indications. While the company is committed to delivering returns, potential investors should keep an eye on financial stability and growth sustainability. A moderate buy for those focusing on high yields.
Smart Data Insight
Master the Perfect Entry & Exit for this Stock
Don't leave your profits to chance. Historically, this stock follows specific seasonal patterns that institutional traders use to maximize returns.
- ✅ Identify the "Golden Buying Window"
- ✅ Avoid high-risk correction cycles
- ✅ Backtested data from the last 20+ years