October 29, 2025 a 03:15 am

PLTR: Trend and Support & Resistance Analysis - Palantir Technologies Inc.
Palantir Technologies Inc. has demonstrated versatile software deployment across various intelligence and operational sectors, making it a formidable player in data integration and artificial intelligence. Recent market trends suggest a noticeable growth in stock movement, with technical indicators pointing towards possible continued uptrend momentum. Technical analysis reveals key levels of support that might provide stability to the stock prices in the near future. However, challenges may arise if resistance zones are not overcome. Overall, the landscape for Palantir appears promising, backed by its technological advancements.
Trend Analysis
| Date | Close Price | Trend |
|---|---|---|
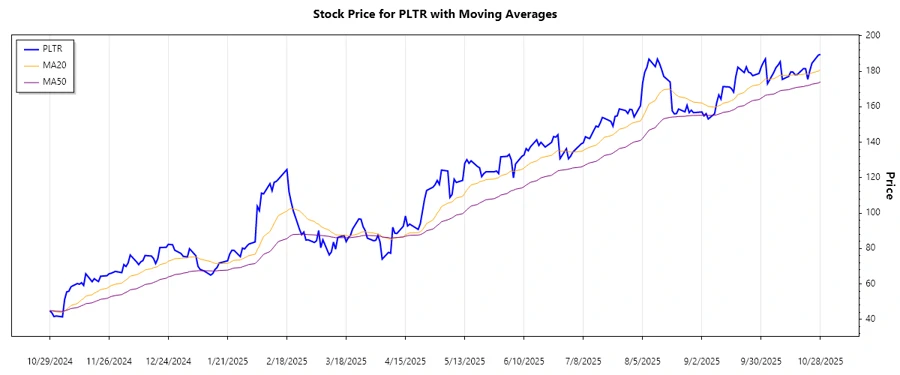
| 2025-10-28 | $189.6 | ▲ |
| 2025-10-27 | $189.18 | ▲ |
| 2025-10-24 | $184.63 | ▲ |
| 2025-10-23 | $180.48 | ▲ |
| 2025-10-22 | $175.49 | ▲ |
| 2025-10-21 | $181.51 | ▲ |
| 2025-10-20 | $181.59 | ▲ |
The analysis suggests an ongoing uptrend as the EMA20 is above EMA50, indicating a favorable market condition for Palantir.
Support and Resistance
| Zone Type | From | To | Direction |
|---|---|---|---|
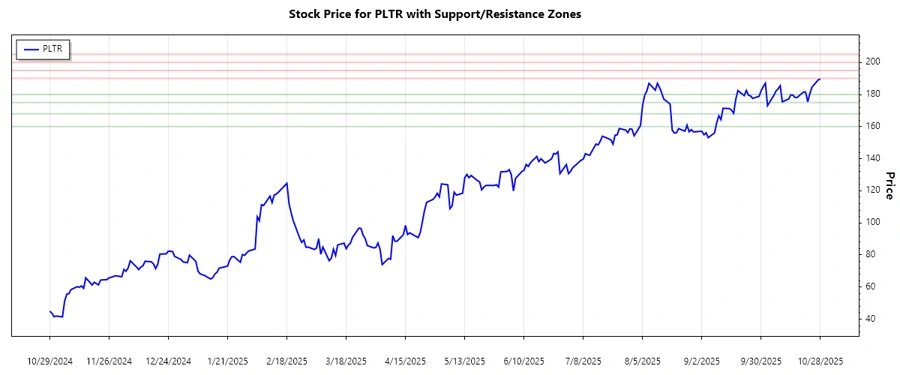
| Support | $175 | $180 | ↔️ |
| Support | $160 | $168 | ↔️ |
| Resistance | $190 | $195 | ↕️ |
| Resistance | $200 | $205 | ↕️ |
The current price is approaching the upper range of the primary resistance zone, signifying a possible breakout if momentum persists.
Conclusion
Palantir Technologies Inc. shows positive growth tendencies as identified by technical analysis metrics. The stock displays strength by trending upwards and targeting significant resistance zones. Yet, investors should remain vigilant of potential pullbacks at these critical resistances. Transformation technologies like AI and data centralization provide substantial growth opportunities for Palantir, albeit with inherent implementation risks. The concise identification of support zones provides security foundations should market conditions fluctuate unfavorably, offering a balance of risk and reward strategy for informed investors.
Smart Data Insight
Master the Perfect Entry & Exit for this Stock
Don't leave your profits to chance. Historically, this stock follows specific seasonal patterns that institutional traders use to maximize returns.
- ✅ Identify the "Golden Buying Window"
- ✅ Avoid high-risk correction cycles
- ✅ Backtested data from the last 20+ years