March 05, 2026 a 06:44 am

PLTR: Fibonacci Analysis - Palantir Technologies Inc.
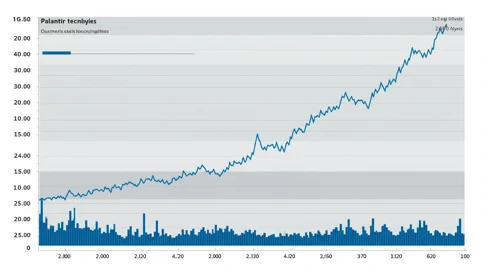
Palantir Technologies Inc.'s stock exhibits a technical downtrend over the analyzed period. Key support levels are crucial for potential reversal scenarios, especially in volatile market conditions. Investors should be cautious due to the possibility of price retest around Fibonacci levels. Technical indicators suggest strategic entry points. Market participants should remain vigilant to potential macroeconomic impacts on the stock's performance.
Fibonacci Analysis
| Trend | Start Date | End Date | High Price (Date) | Low Price (Date) |
|---|---|---|---|---|
| Downward | 2025-11-10 | 2026-03-04 | $207.18 (2025-11-03) | $76.38 (2025-03-10) |
Fibonacci Retracement Levels
| Level | Price |
|---|---|
| 0.236 | $112.78 |
| 0.382 | $126.90 |
| 0.5 | $141.78 |
| 0.618 | $156.66 |
| 0.786 | $178.17 |
The current price is $153.19, which sits near the 0.618 retracement zone. This suggests a potential resistance level, indicating the stock might face challenges breaking through unless there is significant buying pressure.
Conclusion
The technical outlook for Palantir Technologies Inc. suggests investors should be cautious. The stock is experiencing a major downtrend with current prices challenging resistance at the 0.618 Fibonacci level. Traders should monitor for any breakthroughs for potential bullish signs. However, existing support levels may provide opportunities if prices reverse. Macroeconomic factors and company news could influence momentum shifts. In summary, while there's a risk of further declines, being aware of these key technical levels could inform better strategic decisions.