February 08, 2026 a 10:15 am

PLTR: Fibonacci Analysis - Palantir Technologies Inc.
Palantir Technologies Inc. has demonstrated considerable volatility in its stock price over the past few months. The recent trend identified for analysis displays a predominant downtrend, suggesting potential bearish sentiment among investors. Given the strategic importance of its software in intelligence and big data, the stock's performance will likely be closely watched by market analysts and tech enthusiasts alike.
Fibonacci Analysis
The analysis of the recent trend for Palantir Technologies Inc. reveals a clear downward trajectory. Fibonacci levels have been calculated to provide insight into potential support and resistance levels, which are crucial for traders observing retracement patterns.
| Trend Start Date | Trend End Date | High (Price, Date) | Low (Price, Date) | Fibonacci Levels |
|---|---|---|---|---|
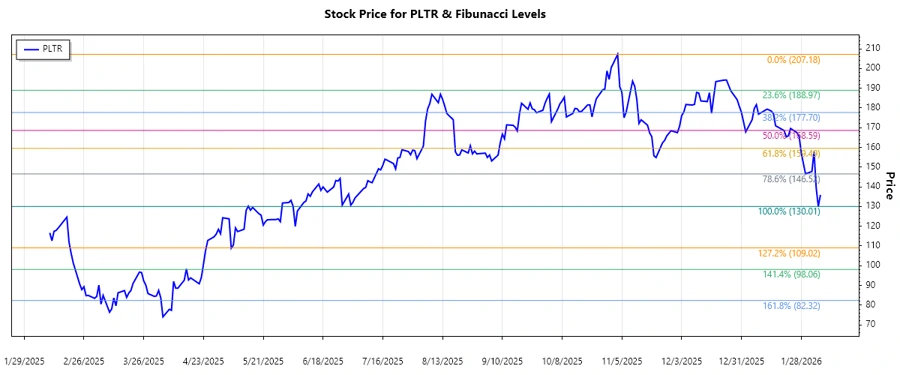
| 2025-10-31 | 2026-02-06 | (207.18, 2025-11-03) | (130.01, 2026-02-05) |
|
The current price, as of February 6, 2026, has moved into the 0.236 retracement level, suggesting potential early resistance or support formation. This level is often indicative of a brief correction in a continuing trend or the onset of a reversal if accompanied by other technical signals.
Conclusion
The recent downward trend in Palantir Technologies Inc.'s stock marks a critical phase for the company, particularly given the high-value contracts and technology innovation at stake. The Fibonacci analysis suggests potential areas of support, which traders will monitor for signs of reversal. Risks involve continued bearish trends reinforcing current resistance levels, whereas opportunities exist in a potential rebound, catalyzed by strategic business developments or improving market sentiment.