December 02, 2025 a 09:03 am
PLD: Trend and Support & Resistance Analysis - Prologis, Inc.
Prologis, Inc., operates in a high-growth industry focused on logistics real estate. The company's stock, represented by the ticker PLD, has shown varying trends over the past months. Historically, it has navigated both substantial uptrends and downtrends influenced by market dynamics and economic conditions. Understanding the trend and support/resistance levels is critical for investors seeking to make informed decisions. The following analysis delves into the recent technical indicators to forecast potential stock movements.
Trend Analysis
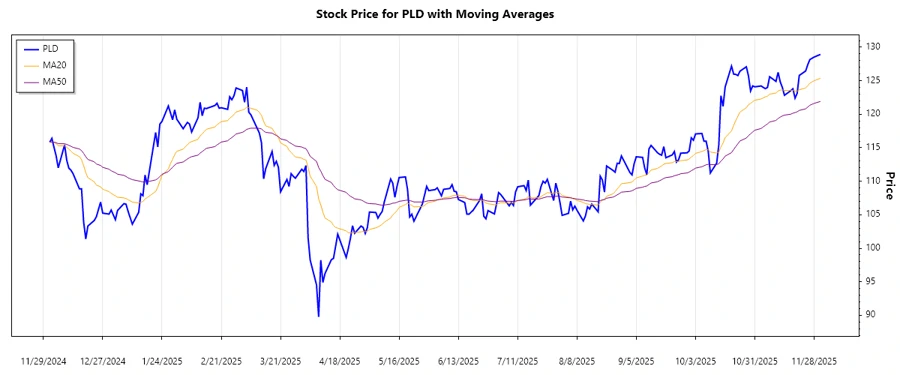
After analyzing the historical price data for Prologis, Inc., the current trend shows a predominantly upward movement as indicated by the EMA calculations. The EMA20 is greater than EMA50 leading us to determine a ◄ Uptrend. The trend is further represented by the changes in the stock price over the last week, cementing this assessment.
| Date | Close Price | Trend |
|---|---|---|
| 2025-12-01 | 128.93 | ▲ |
| 2025-11-28 | 128.53 | ▲ |
| 2025-11-26 | 128.16 | ▲ |
| 2025-11-25 | 127.39 | ▲ |
| 2025-11-24 | 126.45 | ▲ |
| 2025-11-21 | 125.79 | ▲ |
| 2025-11-20 | 123.12 | ▲ |
The upward trend could potentially continue if external conditions remain favorable.
Support and Resistance
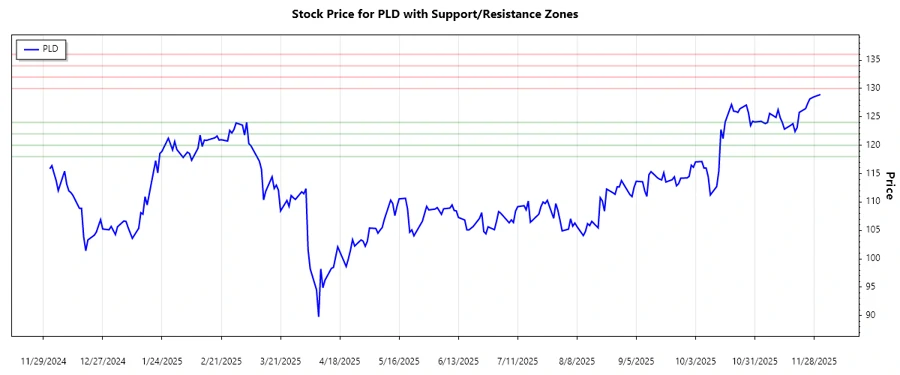
The analysis of support and resistance zones further supports the trend insights gained from the EMA data. Identified zones illustrate potential levels where stock price movement might pause or reverse.
| Zone Type | From | To | Direction |
|---|---|---|---|
| Support Zone 1 | 122.00 | 124.00 | ▲ |
| Support Zone 2 | 118.00 | 120.00 | ▲ |
| Resistance Zone 1 | 130.00 | 132.00 | ▼ |
| Resistance Zone 2 | 134.00 | 136.00 | ▼ |
Currently, the price is near the lower resistance zone, which could suggest a potential breakout or a fallback within the support range. The technical analysis asserts prudent strategies for both upward momentum continuation and a possible avoidance of a reversal back to the identified support levels.
Conclusion
The technical indicators showcase a predominately bullish outlook with a current uptrend for Prologis, Inc. The stock remains resilient near the resistance levels, indicating investor confidence. On the flip side, any failure to breach the resistance might test the support zones in the coming sessions. While conditions favor optimism, investors should remain cognizant of market shifts that could impact these zones. This presents a timely opportunity alongside potential risks for informed financial decision-making.